DagsHub is a platform for data scientists and machine learning engineers to version and sync their data, models, experiments, and code. It allows you and your team to easily share, review and reuse your work, providing a GitHub-like experience for machine learning. DagsHub is built on popular open-source tools and formats, making it easy to integrate with the tools you already use like New Relic.
New Relic includes a model performance monitoring integration with DagsHub to monitor and analyze your machine learning training metrics in real-time.
Integrate DagsHub with New Relic
Integrating DagsHub and New Relic enables you to analyze and monitor machine learning training metrics in real-time. You can visualize your metrics in a New Relic dashboard, create custom metrics, and set alerts to notify you of events and incidents happening during your training runs.
In order to receive data from DagsHub into New Relic, you need your account number and a special key which you can obtain as follows:
- Log into your New Relic account: Go to one.newrelic.com > All capabilities > +Add more data.
- Click on DagsHub: Type DagsHub in the search bar.
- Select the account ID you want DagsHub to integrate with.
- Create an access token: Once you've selected an account ID, under real-time training metrics, click Create an API key . This will be your new telemetry API key. Keep the New Relic page open for future steps.
- Log into the DagsHub portal: Once you're logged in, select the repository you're working on. Click Settings, and select the integrations button from the left-hand menu. Click on the New Relic tile. To learn how to create a project with real-time experiment monitoring, please read the DagsHub MLflow documentation page.
- Copy and paste the token in DagsHub. Go back to the New Relic integration dashboard and copy the token you created by clicking on the copy icon next to the insert key. On the DagsHub's portal, paste the insert key under New Relic Insight insert key, and finish by clicking Next. The token will be verified, and a confirmation screen will appear.
Did this doc help with your installation?
View and explore your DagsHub models in New Relic dashboards
Once you configure the New Relic integration in DagsHub, all the training metrics logged to DagsHub in real time are sent to New Relic.
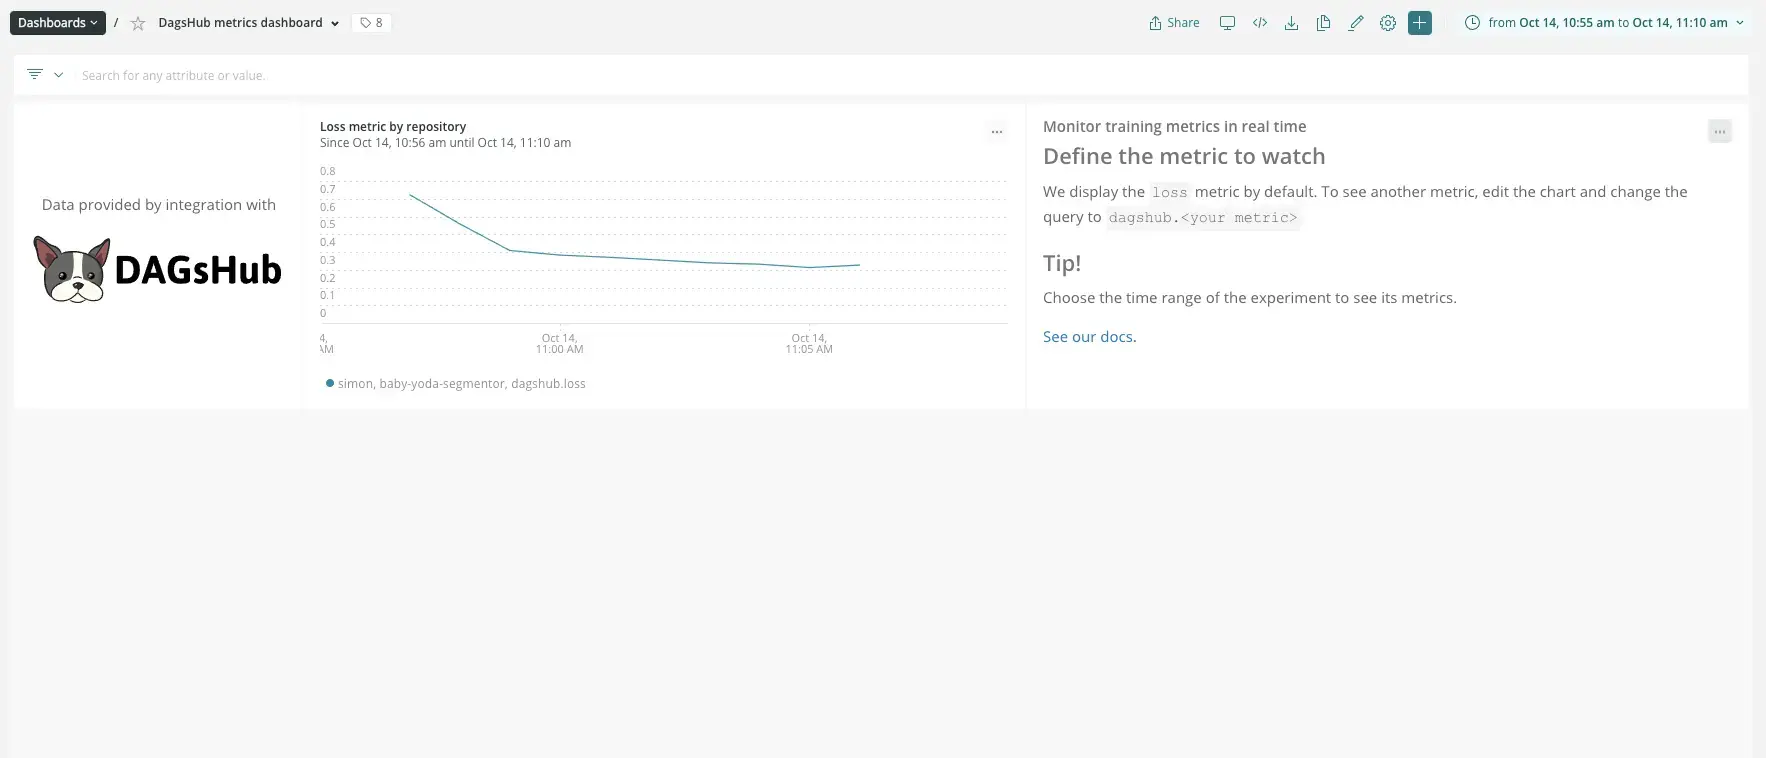
Go to the DagsHub integration dashboard: Once you've tested your tokens and confirmed the integration is set up correctly, return to the New Relic integration dashboard and click on See your data. You will be redirected to an automatically generated New Relic dashboard powered by DagsHub.
Analyze the DagsHub dashboard: The DagsHub dashboard contains one chart, Loss metric by repository, which displays the loss of your models, grouped by their respective repository. It works for any models that you have trained.

Display customized metrics: You can easily customize training metrics coming from DagsHub. For more information on using NRQL and creating queries to track your data, refer to NRQL reference.
Set up alerts notifications: Once you've created some charts inside a Dashboard(s), you can get alerted on your data. To create NRQL conditions from a chart, click the ... chart menu, then click Create alert condition. Once you've named and customized your condition, you can add it to an existing policy, or create a new one.
Get notified: Once you've created an alerts condition, you can choose how you want to be notified. See our docs on how to set up notification channels.
You've now successfully integrated New Relic with DagsHub. Newly created alerts are correlated with your New Relic alerts, and you'll see data about newly reported predictions.