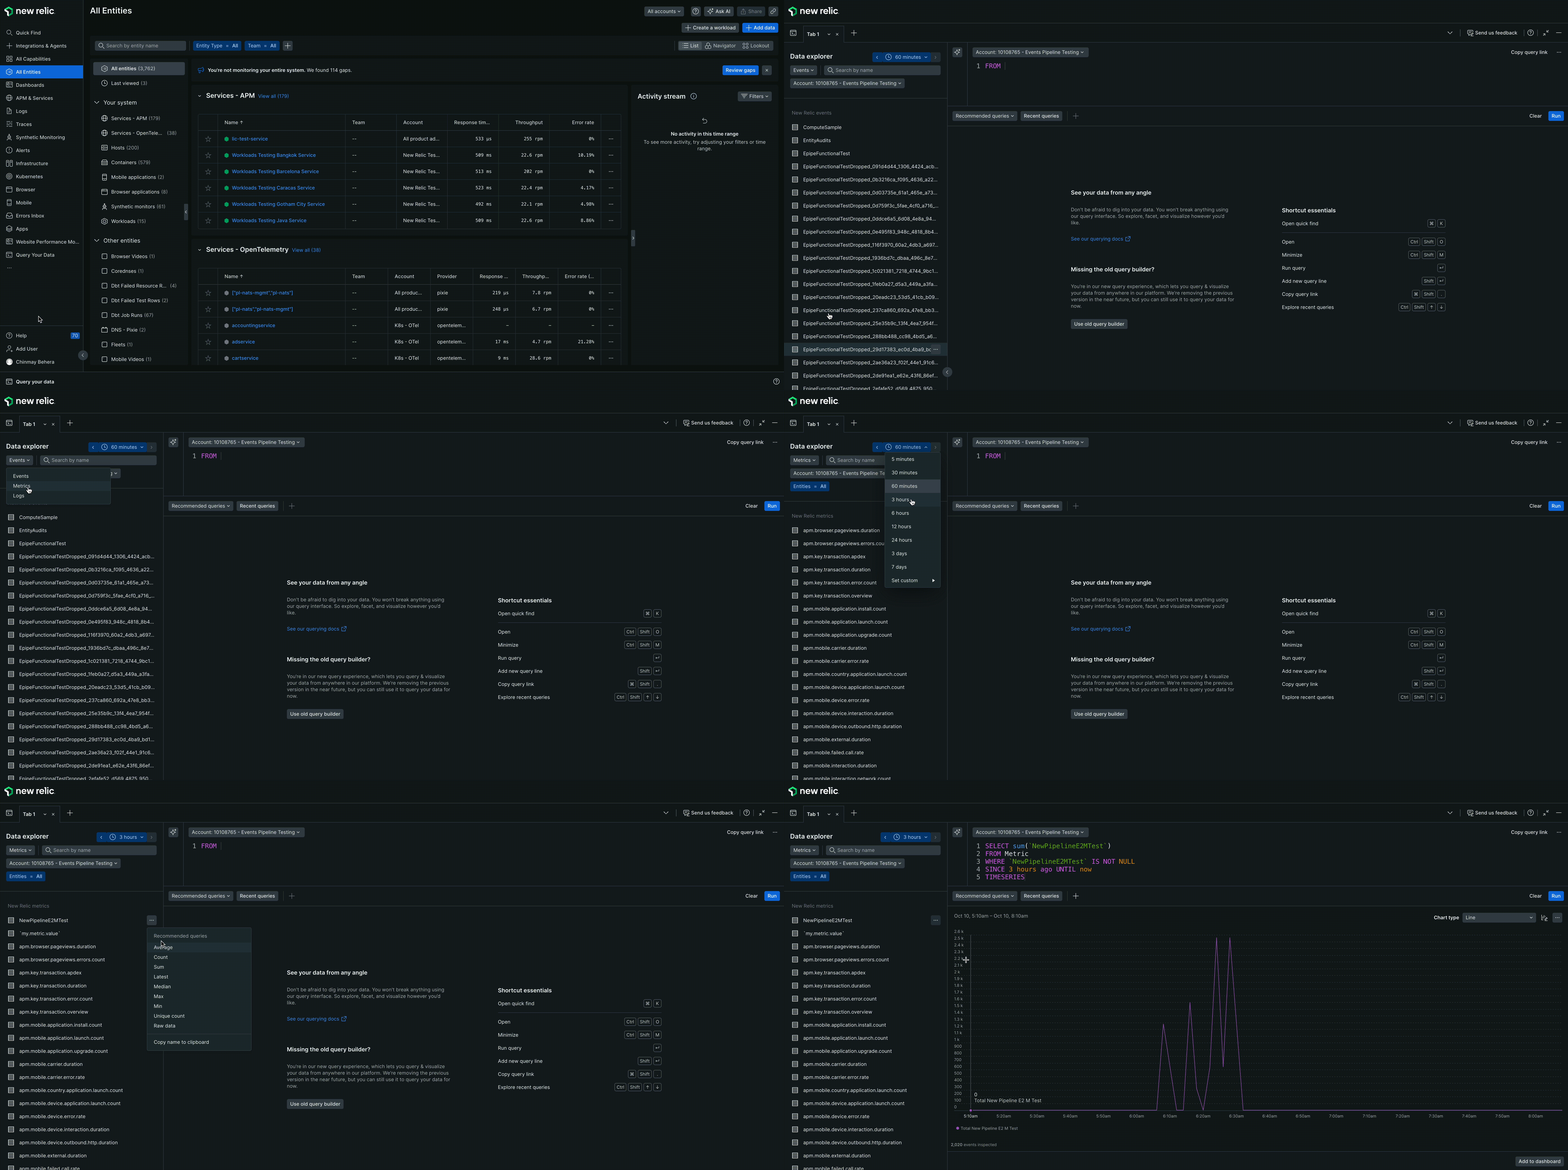
The new default querying experience now includes an integrated data explorer, making it easier to get insights from all your data. With an intuitive, fully resizable point-and-click UI, the data explorer helps you better understand metrics, events, and logs--without having to manually write NRQL queries.
Understand your metrics
The data explorer acts as a metric catalog where you can easily view your metrics and explore their dimensions in a snap. Click the three dot menu to automatically generate a recommended query.
Plus, if you're working with OpenTelemetry, the data explorer will show descriptions to help you better understand your OTel metrics.

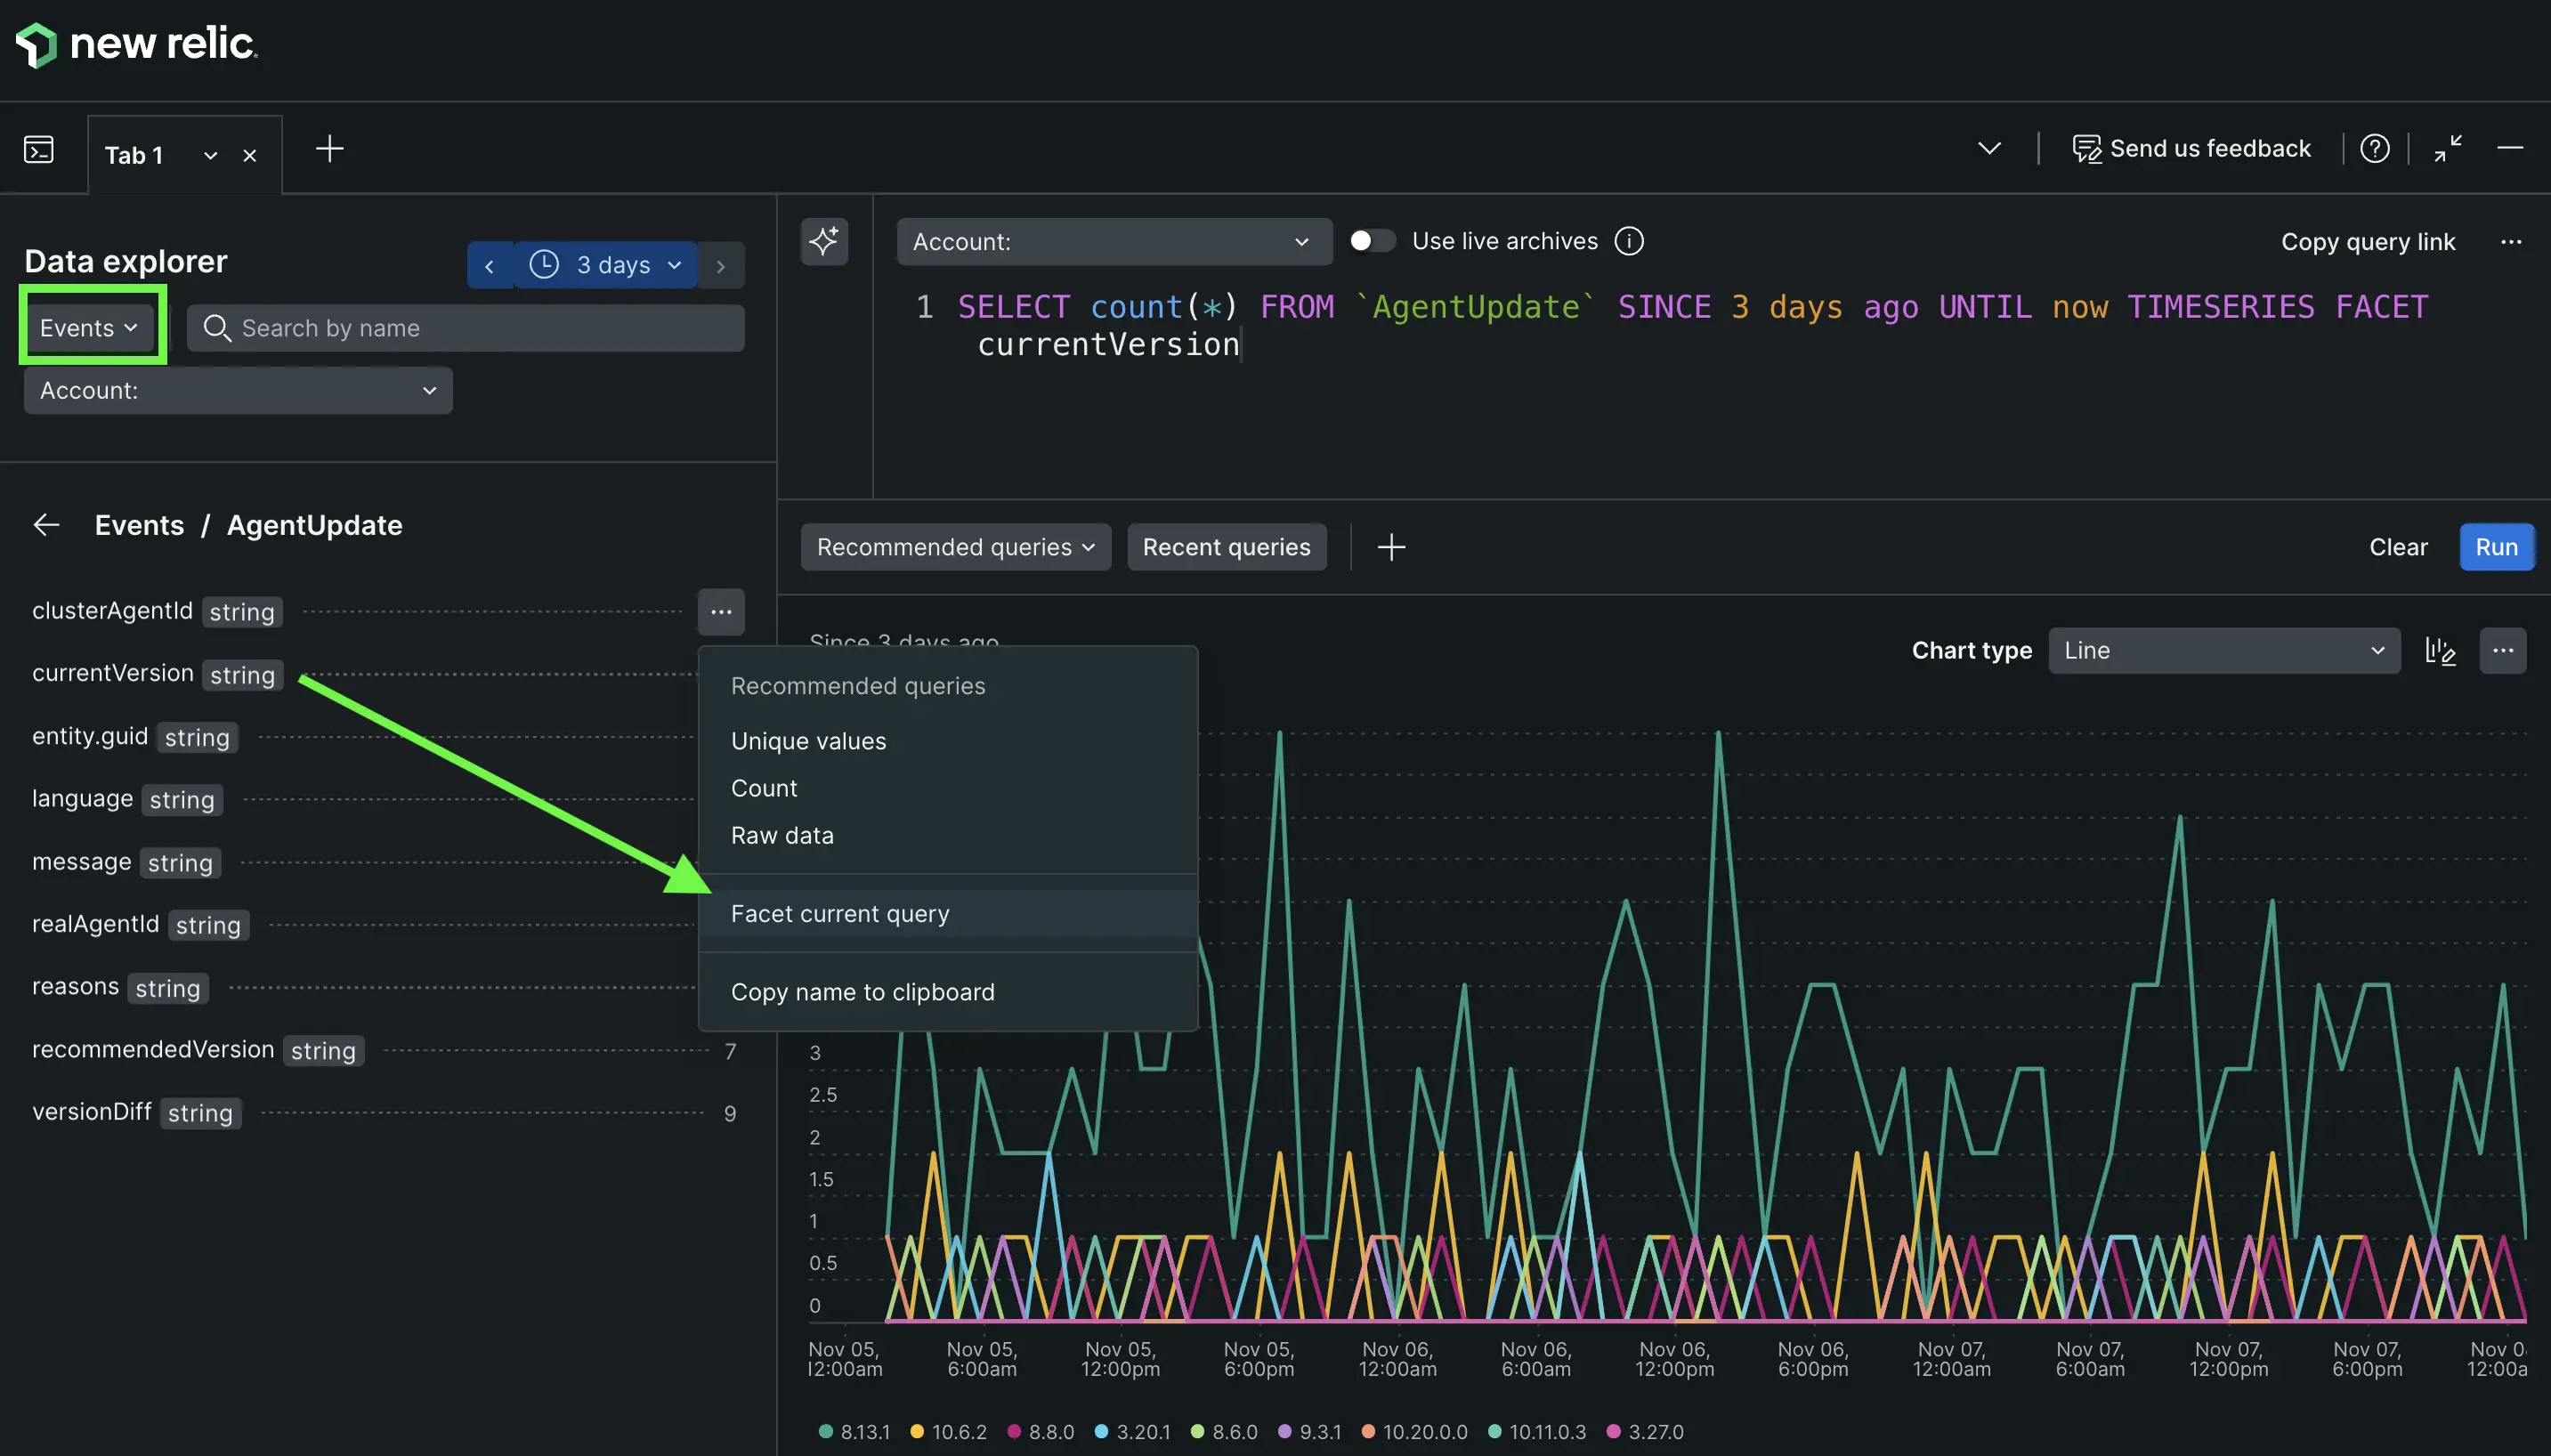
Explore events
Browse all the NR events including your custom events. Know what every event and attribute is thanks to the integrated data dictionary.

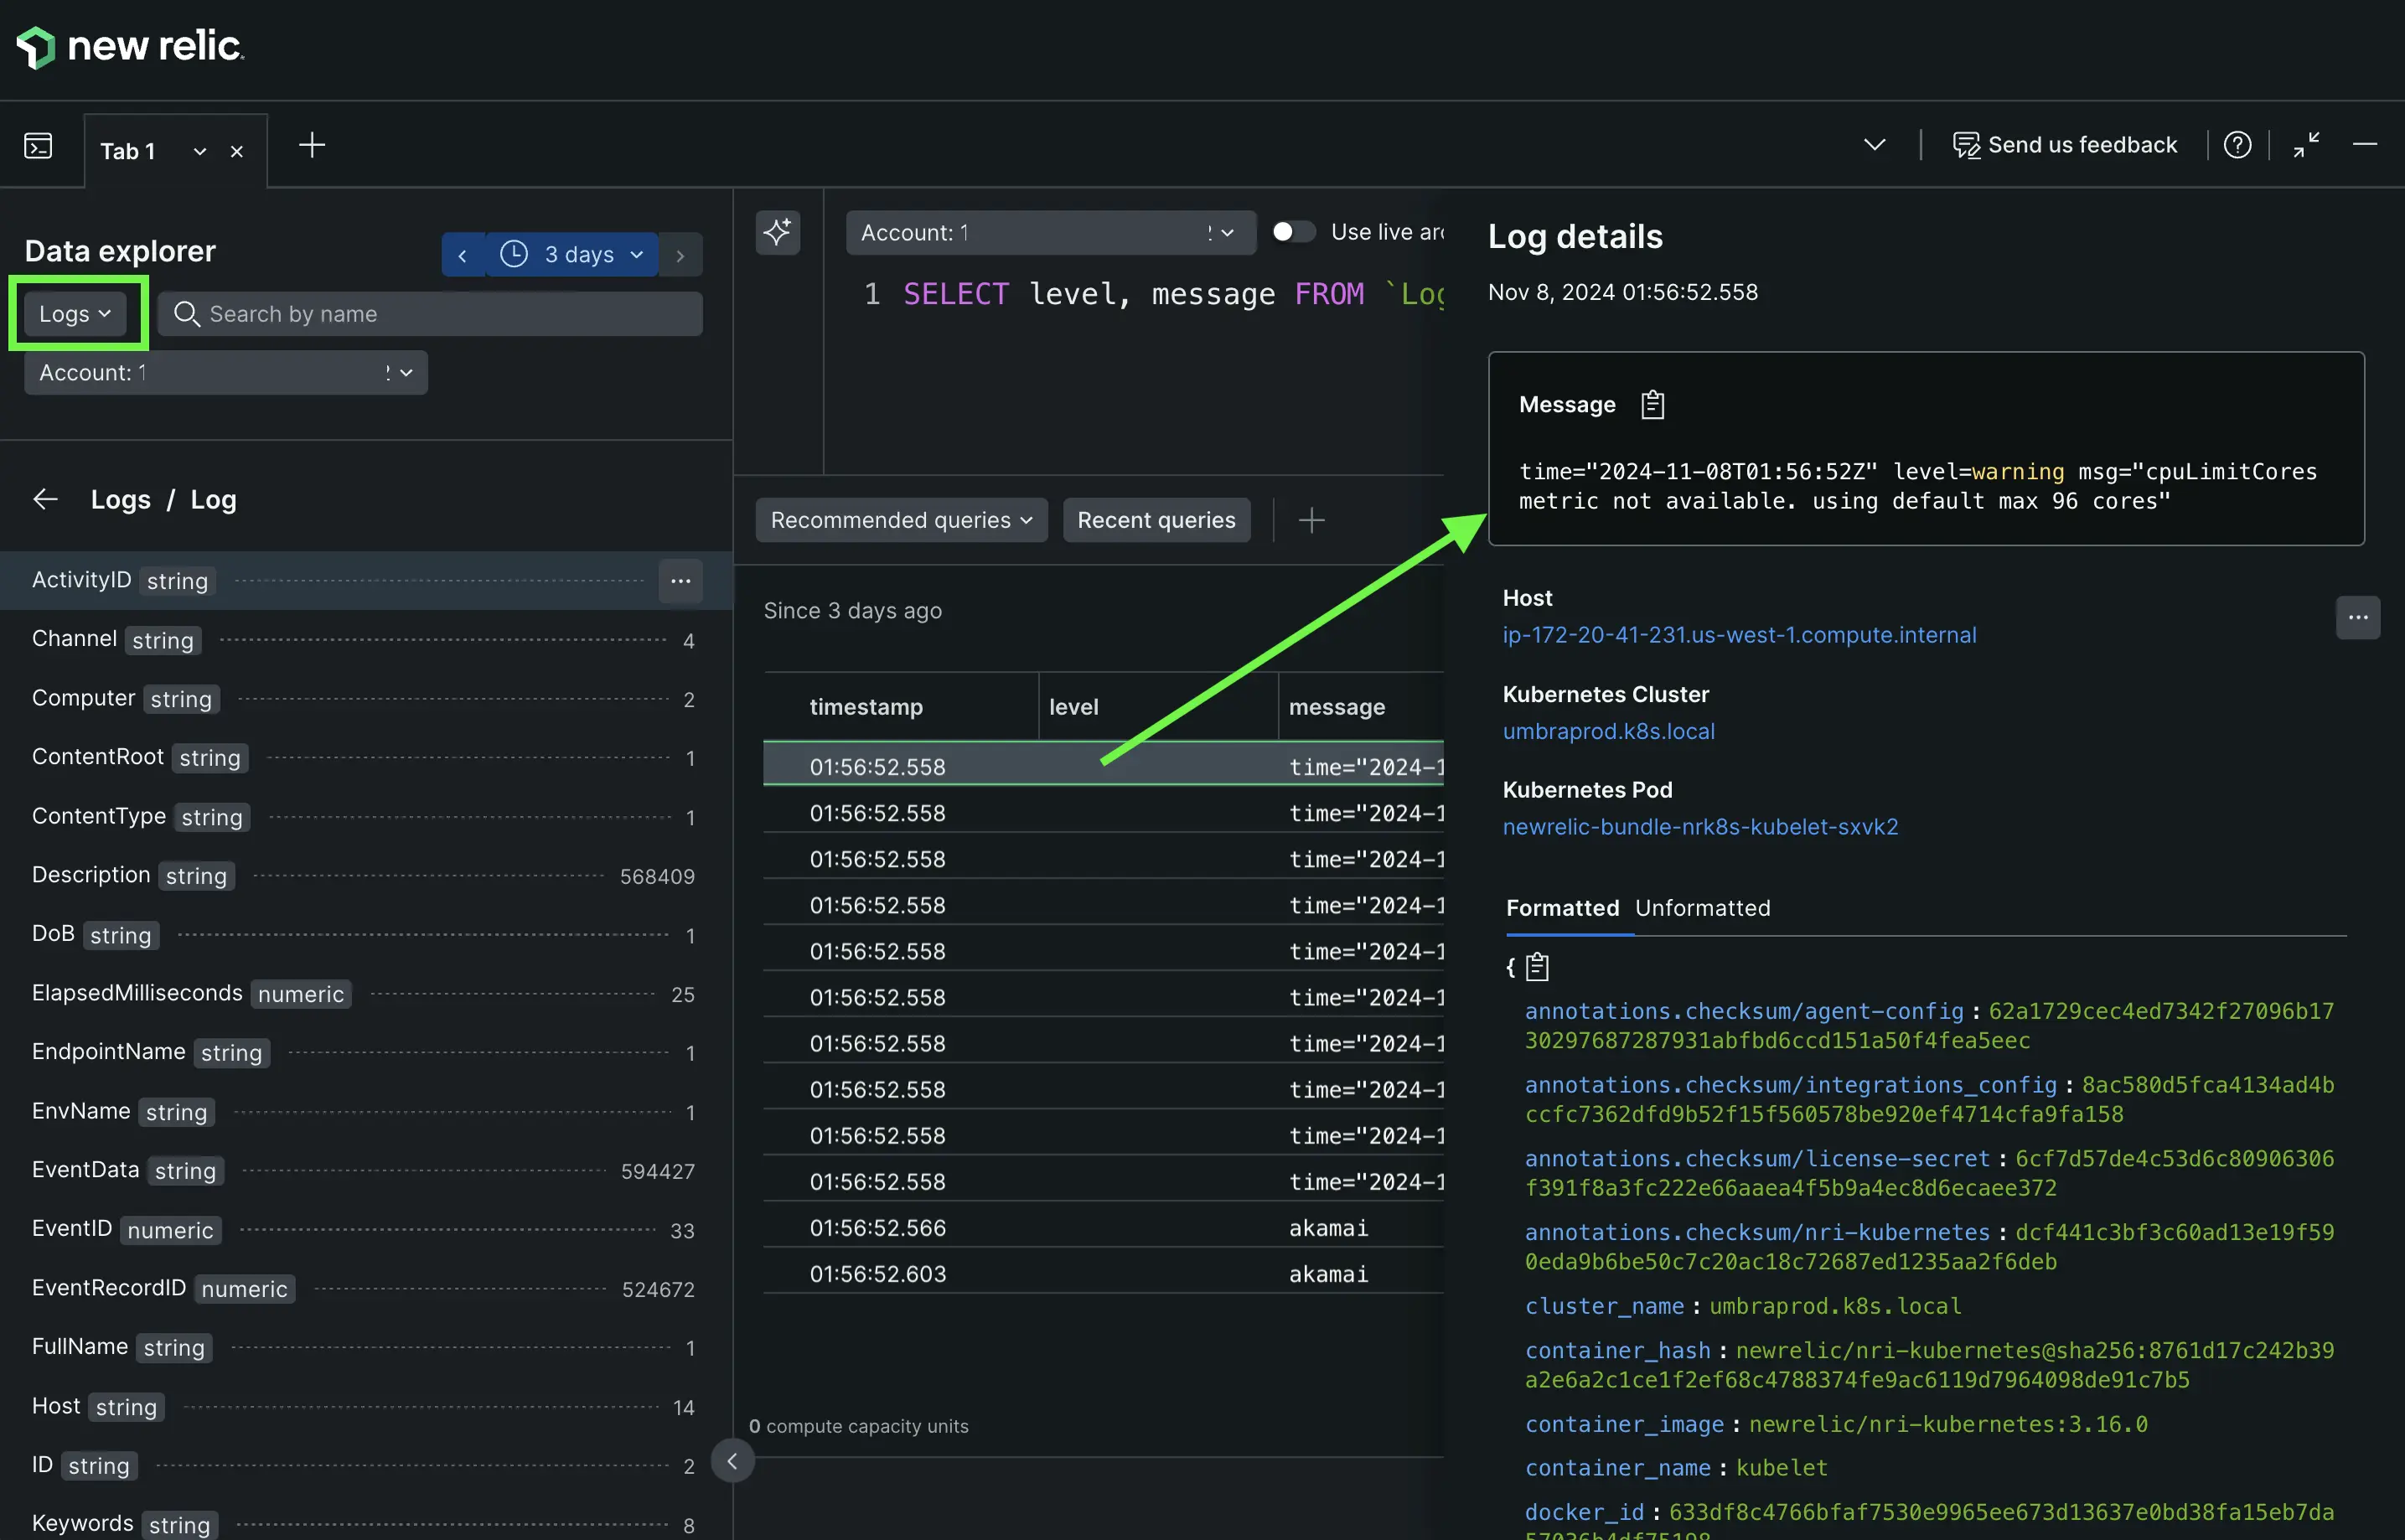
See all logs
Explore all log partitions with an easy point and click interface that helps you create queries and explore all your attributes and values. You can even dive deeper into individual logs for additional details, without leaving your query.

Integrated with the new querying UI
Because it's built into the new query your data capability, you can access the data explorer from anywhere in the platform, without losing the context of what you are already working on. Plus, you can use up to 100 separate tabs to streamline your data exploration with multiple queries.
Learn more about the data explorer in the docs and watch the video below, or read our tips on how to make the most of the new query your data UI.