When analyzing your data, it's important to know at a glance whether a metric needs your attention. Someone viewing your chart may not know the context of whether a number is normal, or more importantly, not normal.
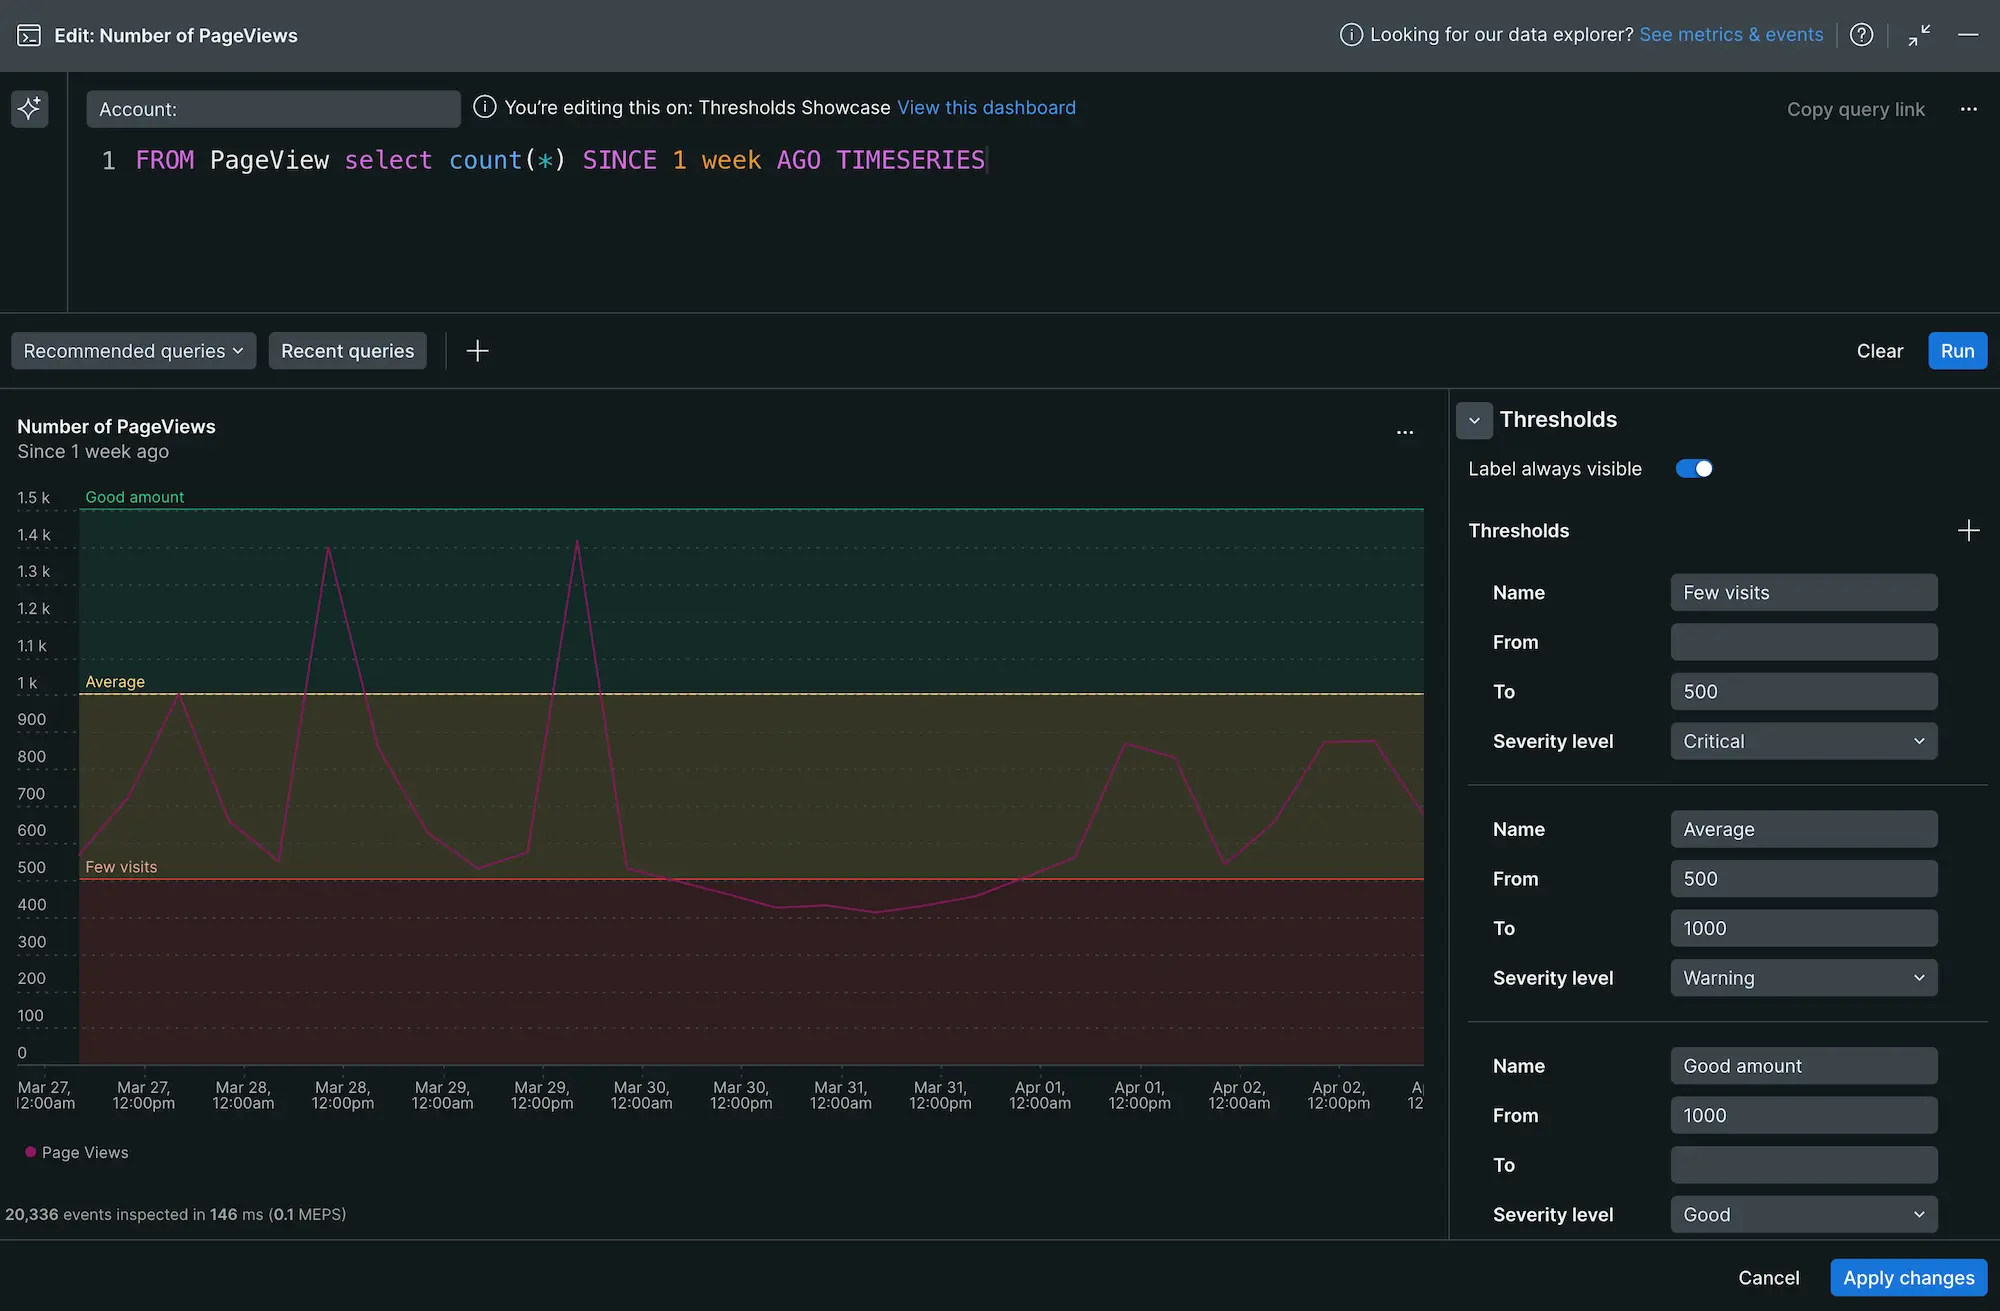
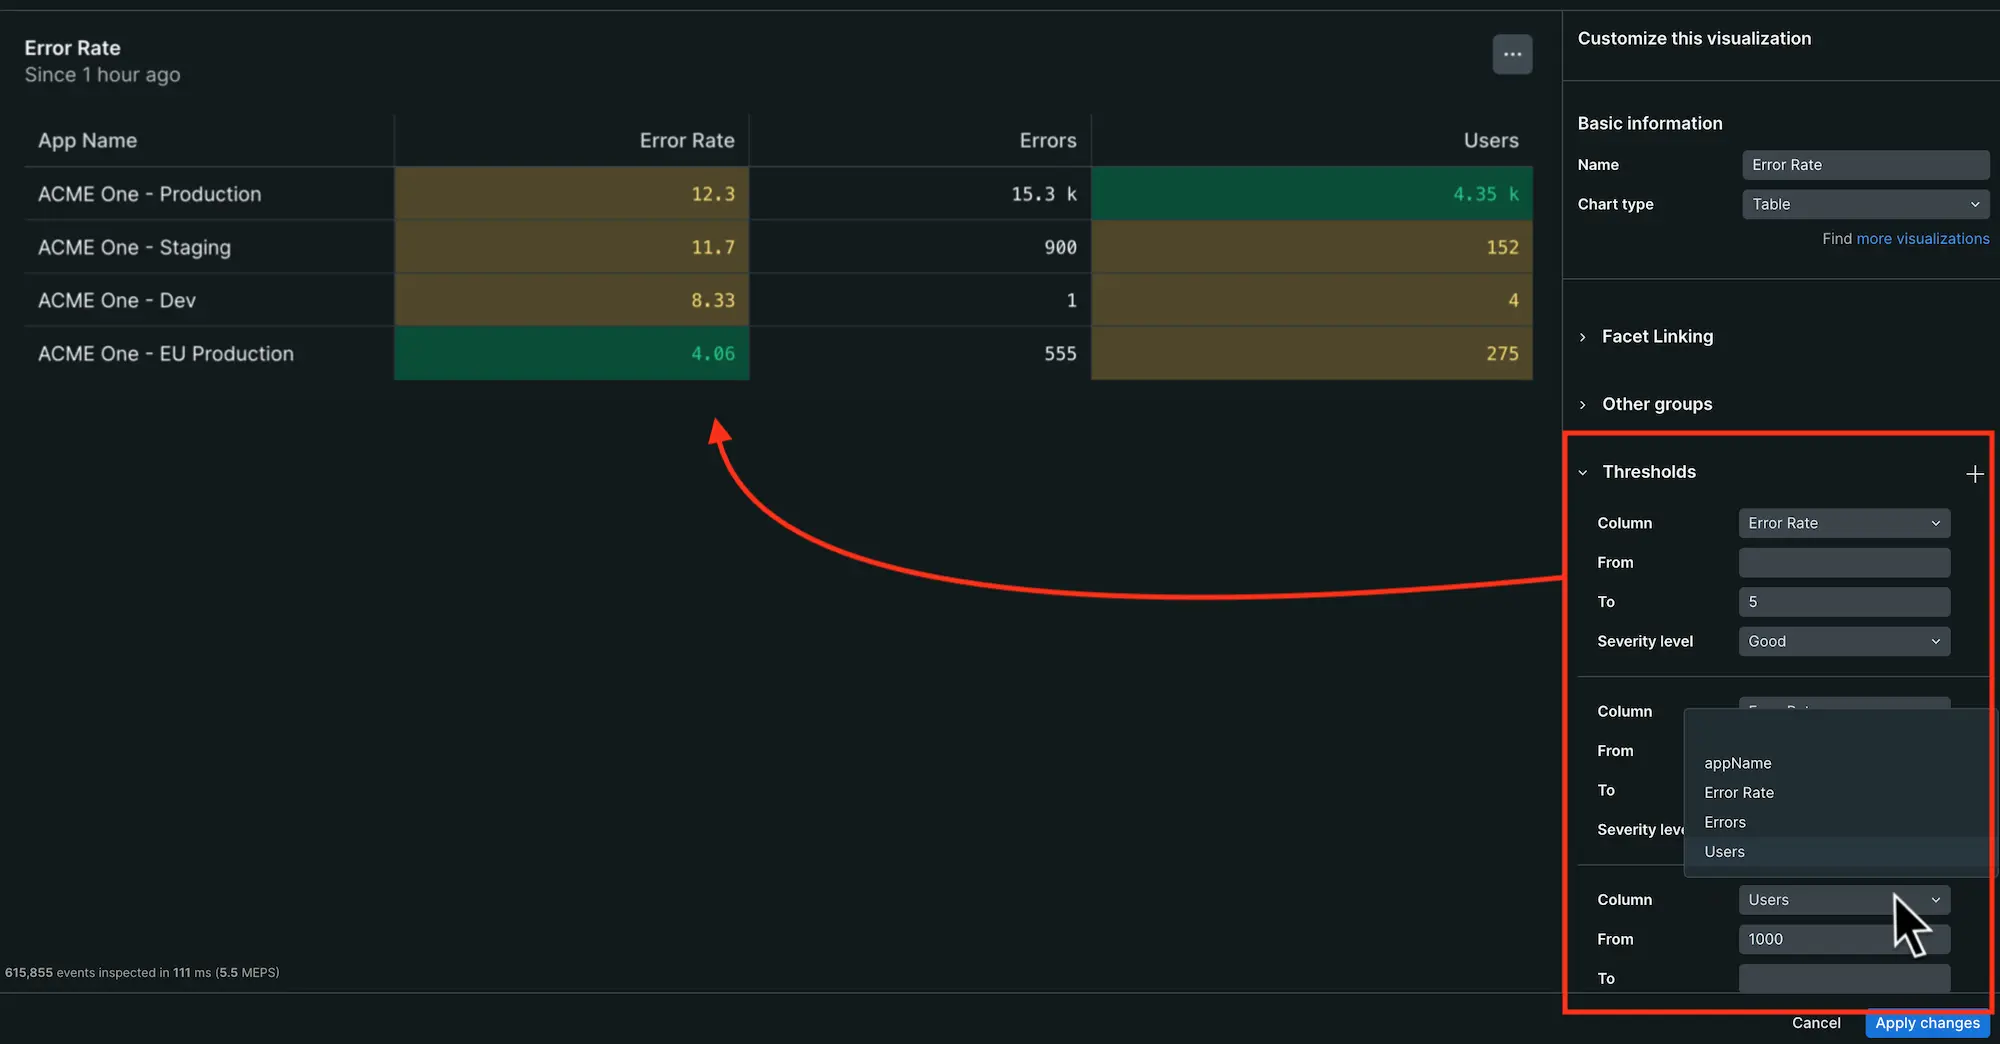
That's why we've released a new thresholds feature that lets you draw custom lines and regions to label your line time-series charts and tables. This feature allows you to add more context to your dashboard customizations and make data more easily understood.
With thresholds you can:
- Specify boundaries in time series charts
- Set colored regions in times series charts
- Set only the lower value to set a minimum boundary and shade everything above that value
- Set only the higher value to shade everything below
- Color cells in a table depending on its value
- Add multiple thresholds in a single chart or table to show varying degrees of severity
How to configure thresholds
In time series charts:
- Edit the chart and expand the Thresholds menu.
- Select + to add a threshold and enter a Name.
- Enter values for From and To. If you want to create a single line, enter the same number for both fields.
- Select a Severity level. This determines the color of the line and/or region.

In tables:
- Edit the table widget and expand the Thresholds menu.
- Select + to add a threshold and select a Column.
- Enter values for From and To. To set an upper bound, leave the From field empty. To set a lower bound, leave the To field empty.
- Select a Severity level. This determines the color of the cell.

Remove a threshold
To remove a threshold marker or region, hover over one of the fields and select the - symbol beside the Name field.
Learn more
Learn more about how you can customize charts by reading the docs page.