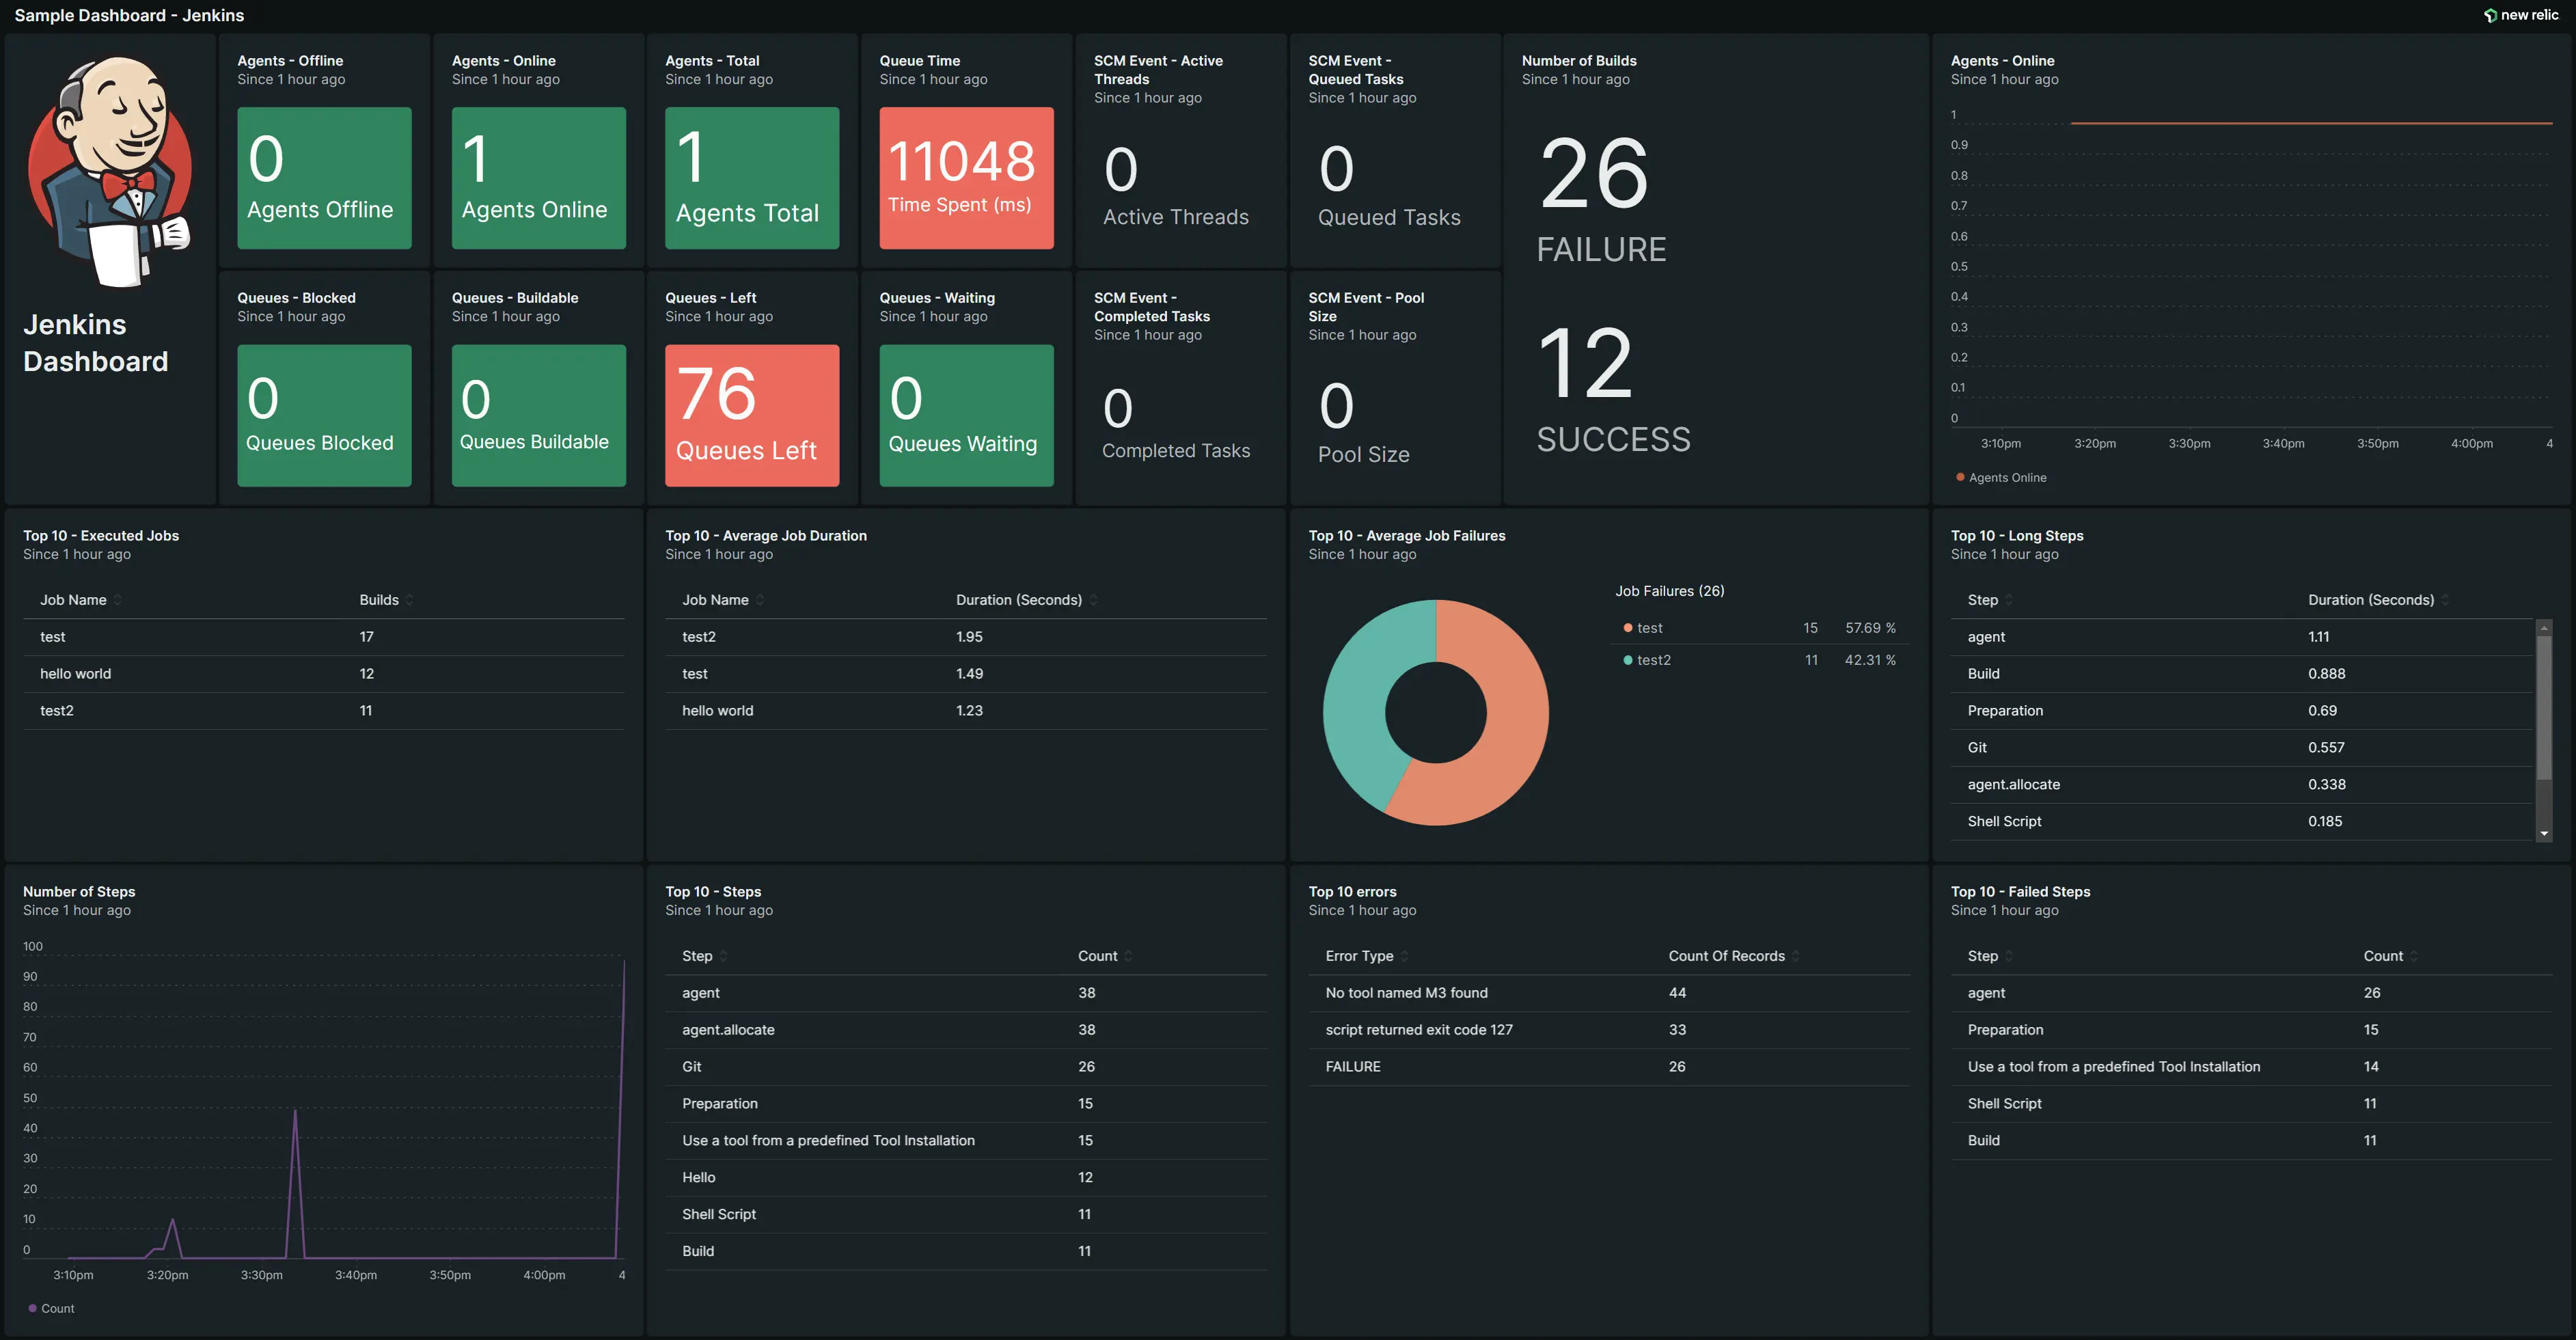
You can now monitor your Jenkins data with New Relic using the Jenkins OpenTelemetry plugin. Jenkins is a popular open-source automation tool for implementing continuous integration (CI) and continuous development (CD) workflows called pipelines. The Jenkins OpenTelemetry plugin makes it easier to get observability into your CI/CD pipeline health and performance.

Improve your jobs and builds with pipeline observability
Sending your Jenkins pipeline data to New Relic provides visibility into the building and deployment phases of the DevOps lifecycle. The Jenkins plugin gives you more insights into your DevOps practices and helps you shift left.
With the Jenkins integration and quickstart, you can easily:
- Understand the health of your Jenkins pipelines at a glance with a pre-built dashboard showing key metrics about your builds, agents, queues, jobs, and more.
- See exactly where pipelines start failing with distributed traces, allowing you to create appropriate alerts
- View Jenkins console logs in context of your pipeline build steps
Get started
To start monitoring Jenkins in New Relic:
- Watch the video above for a demo walkthrough
- Read the blog and documentation for set up instructions
- Install the quickstart to get the out-of-the-box Jenkins monitoring dashboard