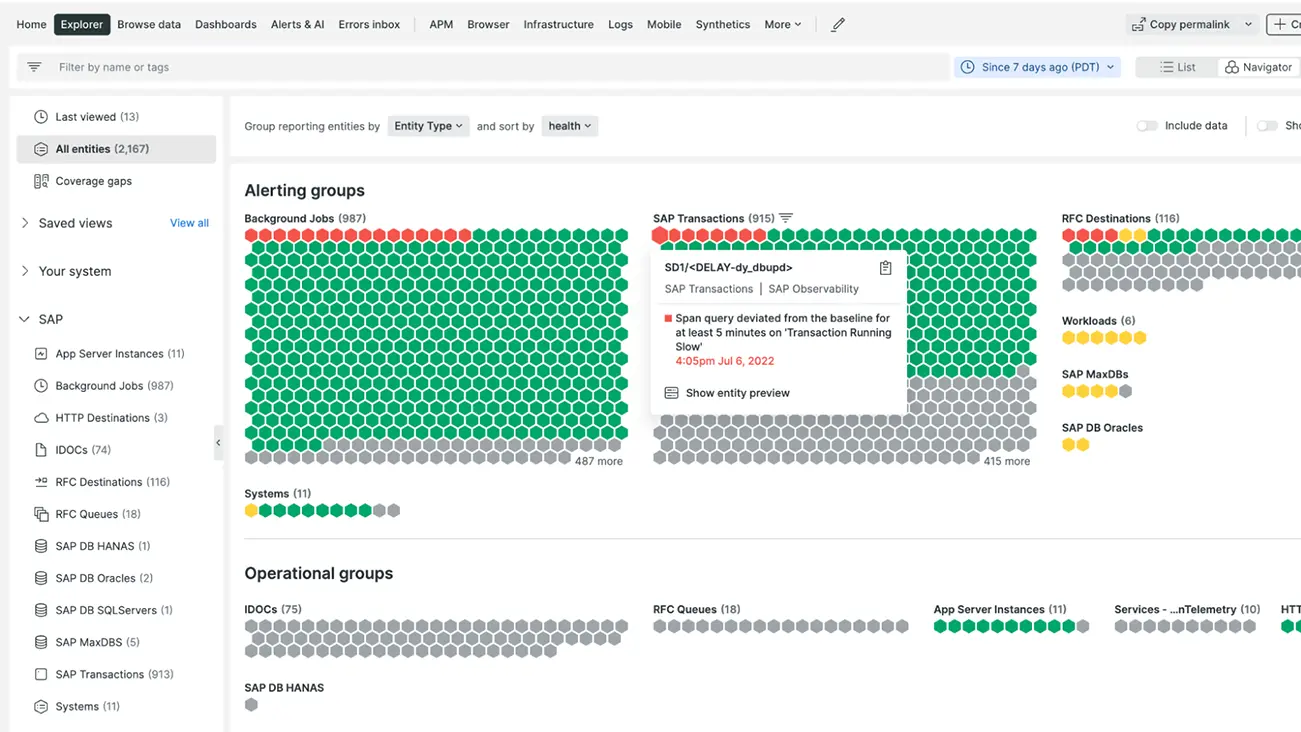
Recently, we launched New Relic Monitoring for SAP Solutions, where you can now inspect all of your SAP and non-SAP systems through one centralized view of your infrastructure, application, and business processes.

Now you will be able to:
- See SAP application performance and overall health data in one place. Your telemetry metrics, events, logs, and traces all come together in a central view within our UI.
- View your data in relation to your business processes. Understand your infrastructure and application data from the viewpoint of your corresponding business processes, such as order-to-cash and procure-to-pay.
- Spot problems quickly with visualizations. By querying and viewing relevant data in our customizable charts and dashboards, you can identify root causes and resolve problems.
- Prevent problems before they occur. Use our advanced alerting functionality to be notified about problems before they impact your customers.
- Install monitoring centrally for end-to-end visibility. This tool can be installed on a central monitoring server, so you won’t need to install agents on all of your SAP production servers.
Read more about it in our solution page, our launch blog post, and our SAP integration documentation. You may also reach out to your New Relic sales rep or request a demo.