New infrastructure monitoring is generally available today
Today, New Relic is making the new infrastructure monitoring experience generally available to help DevOps, SRE, and IT Operations teams proactively identify and resolve issues in their public, private, and hybrid cloud infrastructure.
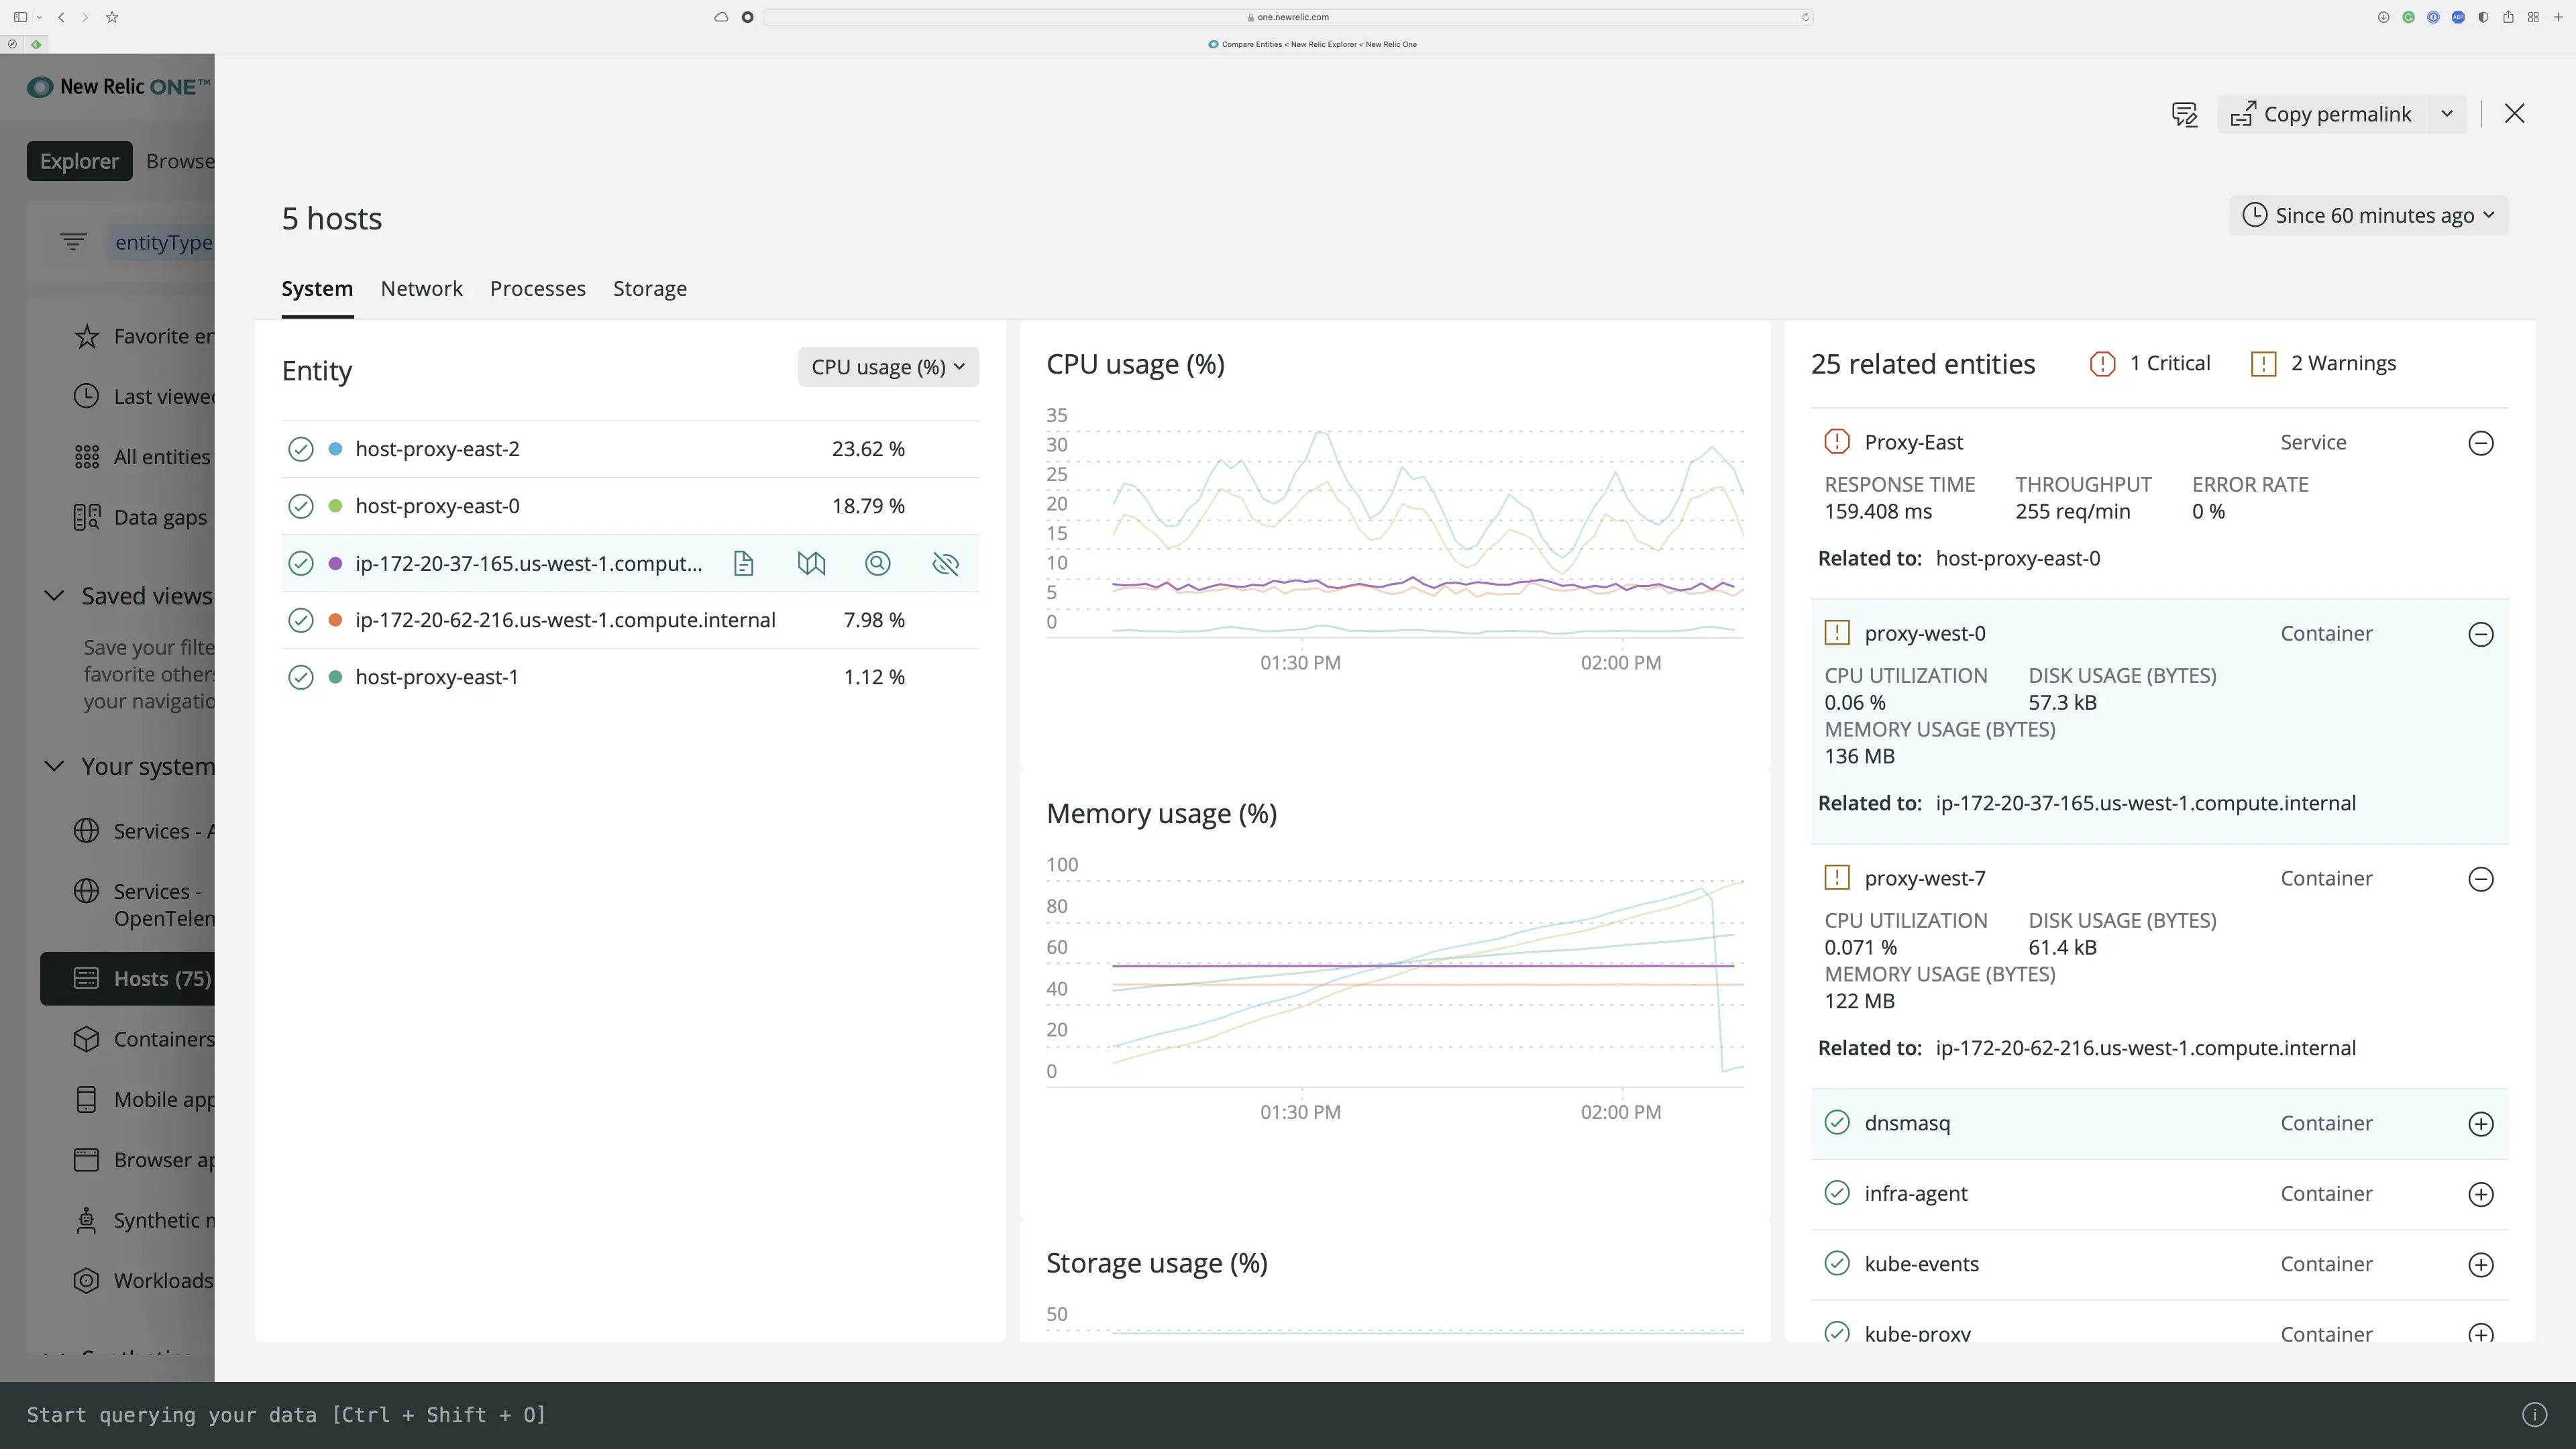
New infrastructure monitoring interface makes it easy to find and compare possible infrastructure components.

Highlights
- Pinpoint bottlenecks instantly using New Relic Lookout to know where to focus your attention.
- Be proactive and find potential infrastructure issues before they affect your customers.
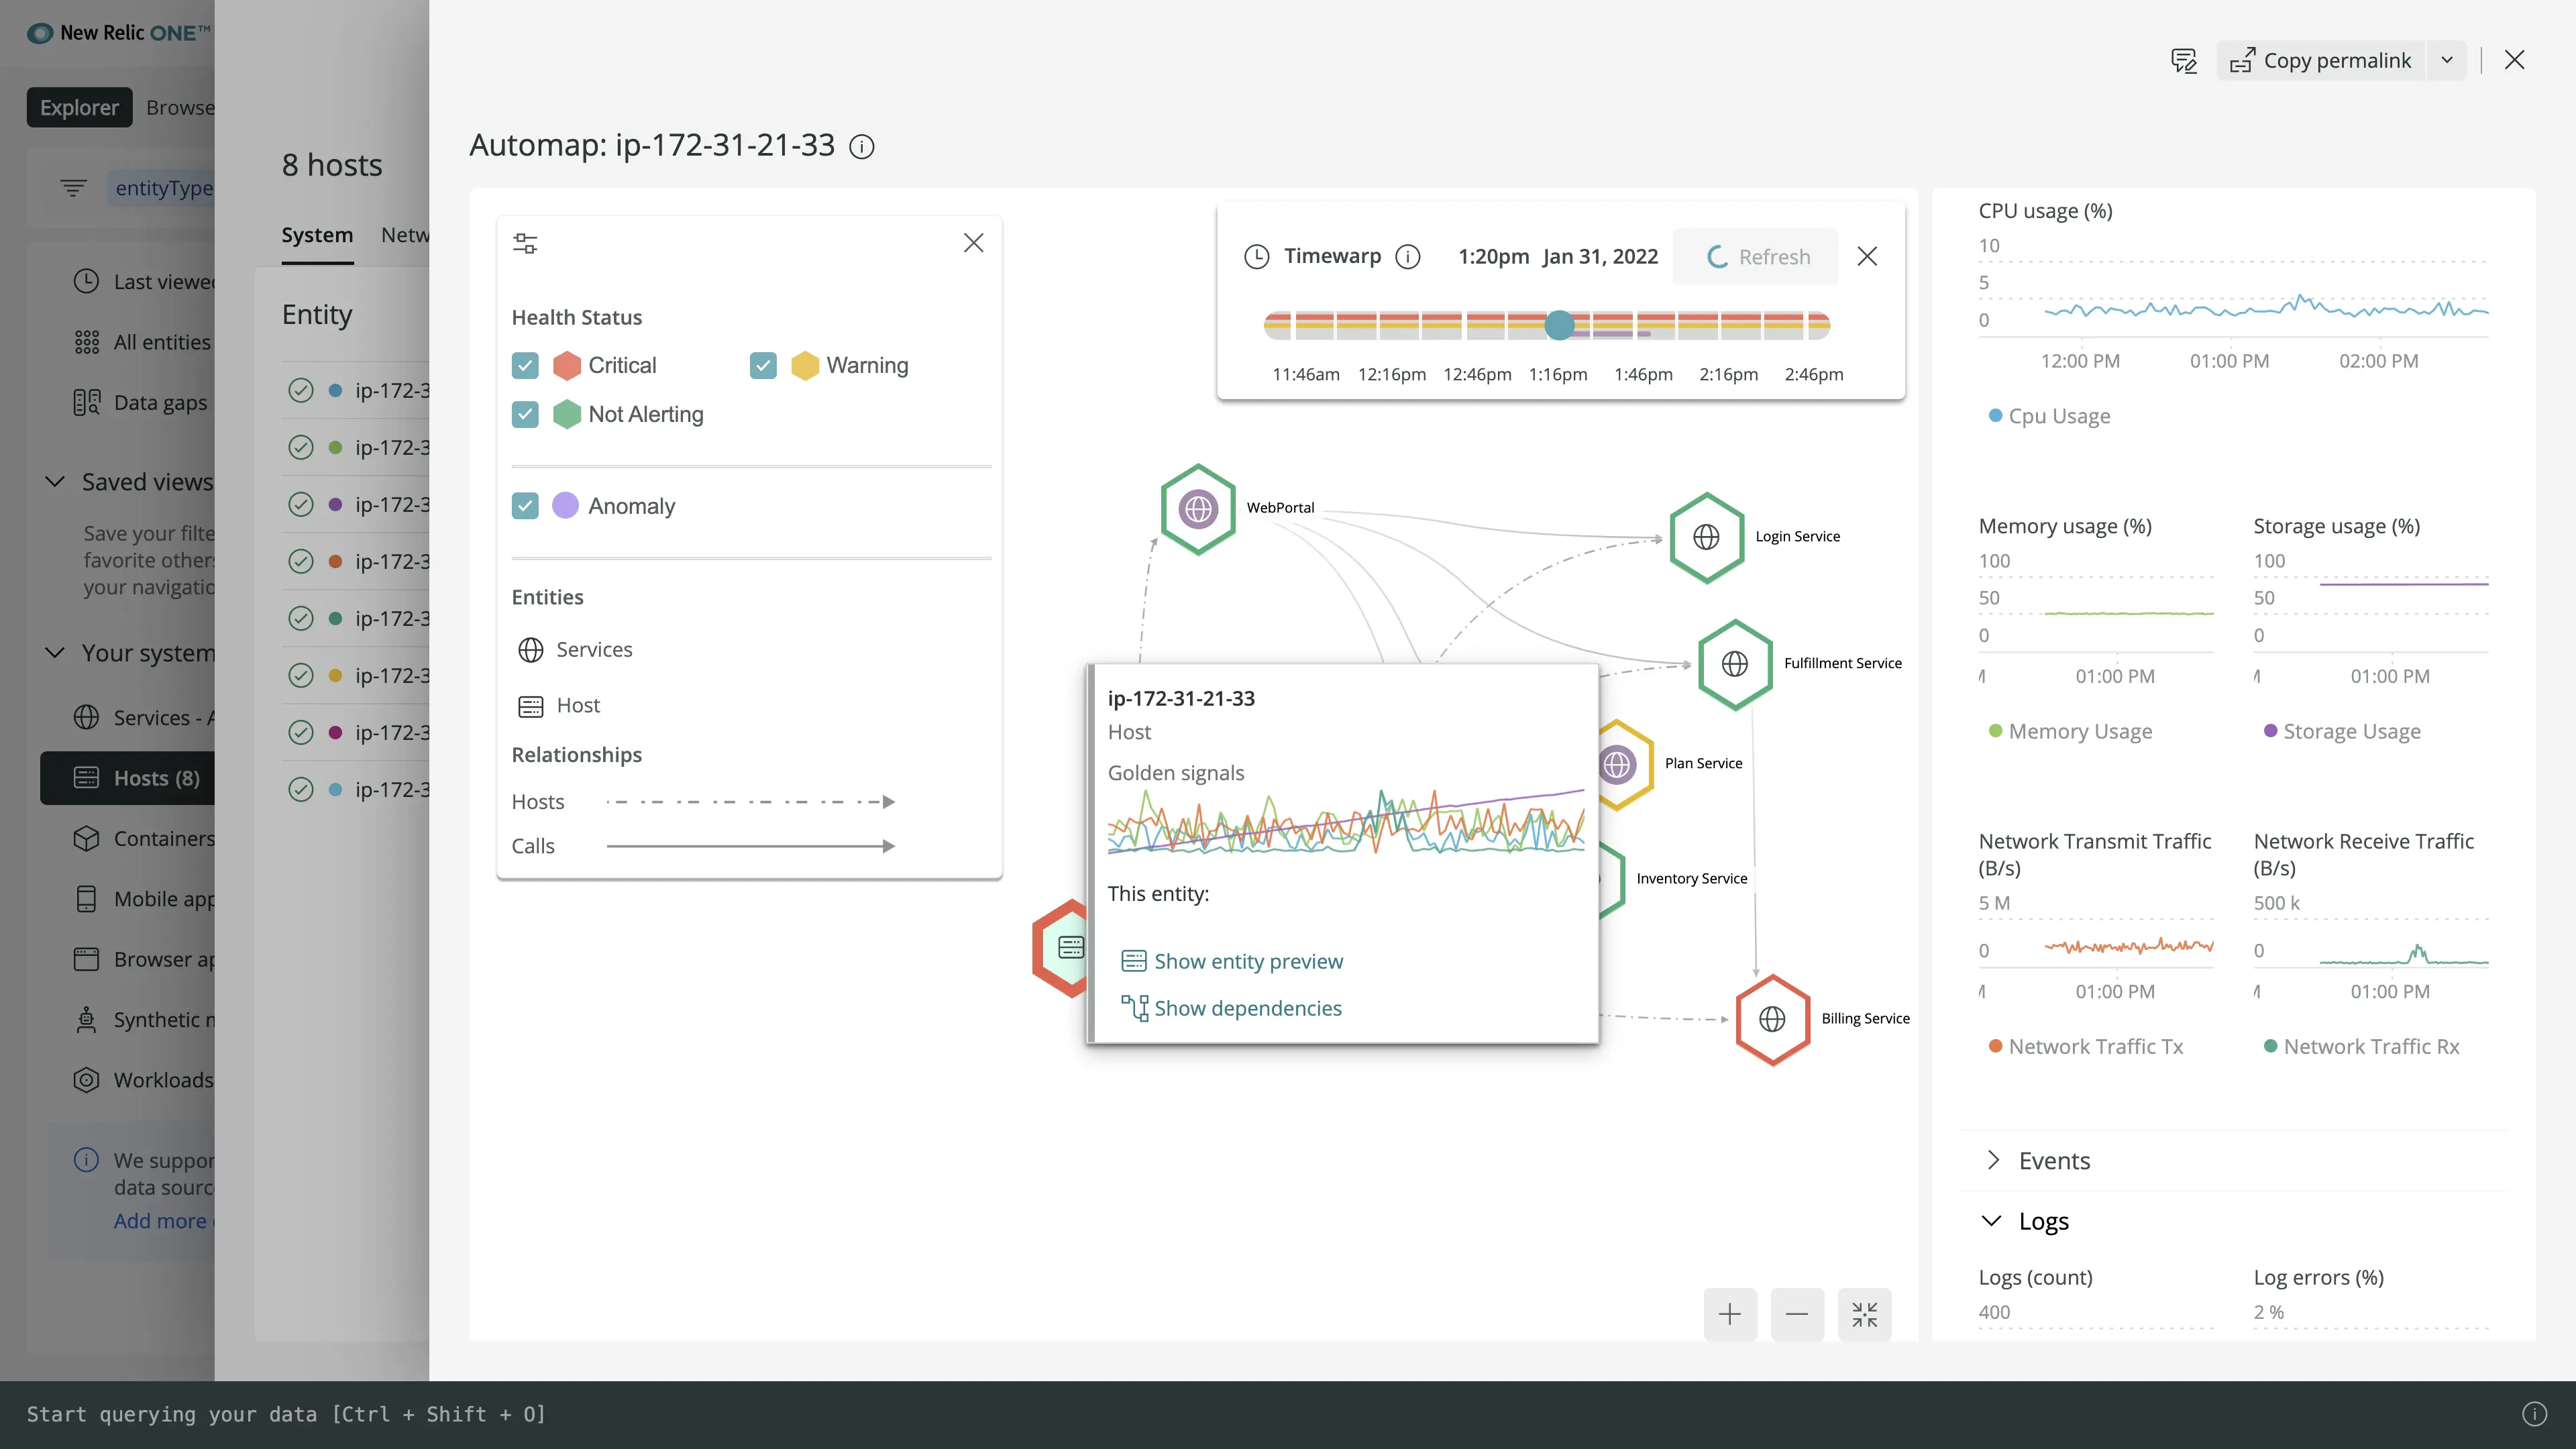
- Quantify impact radius and determine by visualizing a timeline of dependencies using automap. Use timewarp to find what and when the issue occurred.
- Investigate root cause by analyzing related entities, logs, alerts, events, golden signals, network metrics, processes, storage and more all in context a unified experience to identify the root cause and resolve issues faster.

Automap shows topology and the impact radius. Timewarp helps to find what and when an issue happened.
With our new infrastructure monitoring experience, we’ve doubled down on providing real-time troubleshooting workflows while incorporating broader platform context and unique topology visualizations into our user experience.
Check out our new infrastructure monitoring experience and tell us what you think. New Relic full platform access users across all regions can start using it today without any additional cost. Find it in New Relic One within the main menu under Infrastructure > Hosts New. You can also read the new infrastructure UI docs.
One last item With this release of infrastructure monitoring we've upgraded your filter sets into saved views. These saved views are now available for use in the Explorer. To modify or add saved views go to Explorer.