New Relic Explorer lets you discover emerging issues in real time, without relying on static, pre-configured thresholds or dashboards, because crucial changes in your estate are highlighted across all your accounts. View everything in one place, including open source and third-party data, with zero configuration. At a glance, gain instant understanding of health and changes across your entire environment so you can zoom in to analyze, understand, and resolve issues faster.
New Relic Explorer includes several new approaches to visualizing, exploring, and understanding your entire estate:
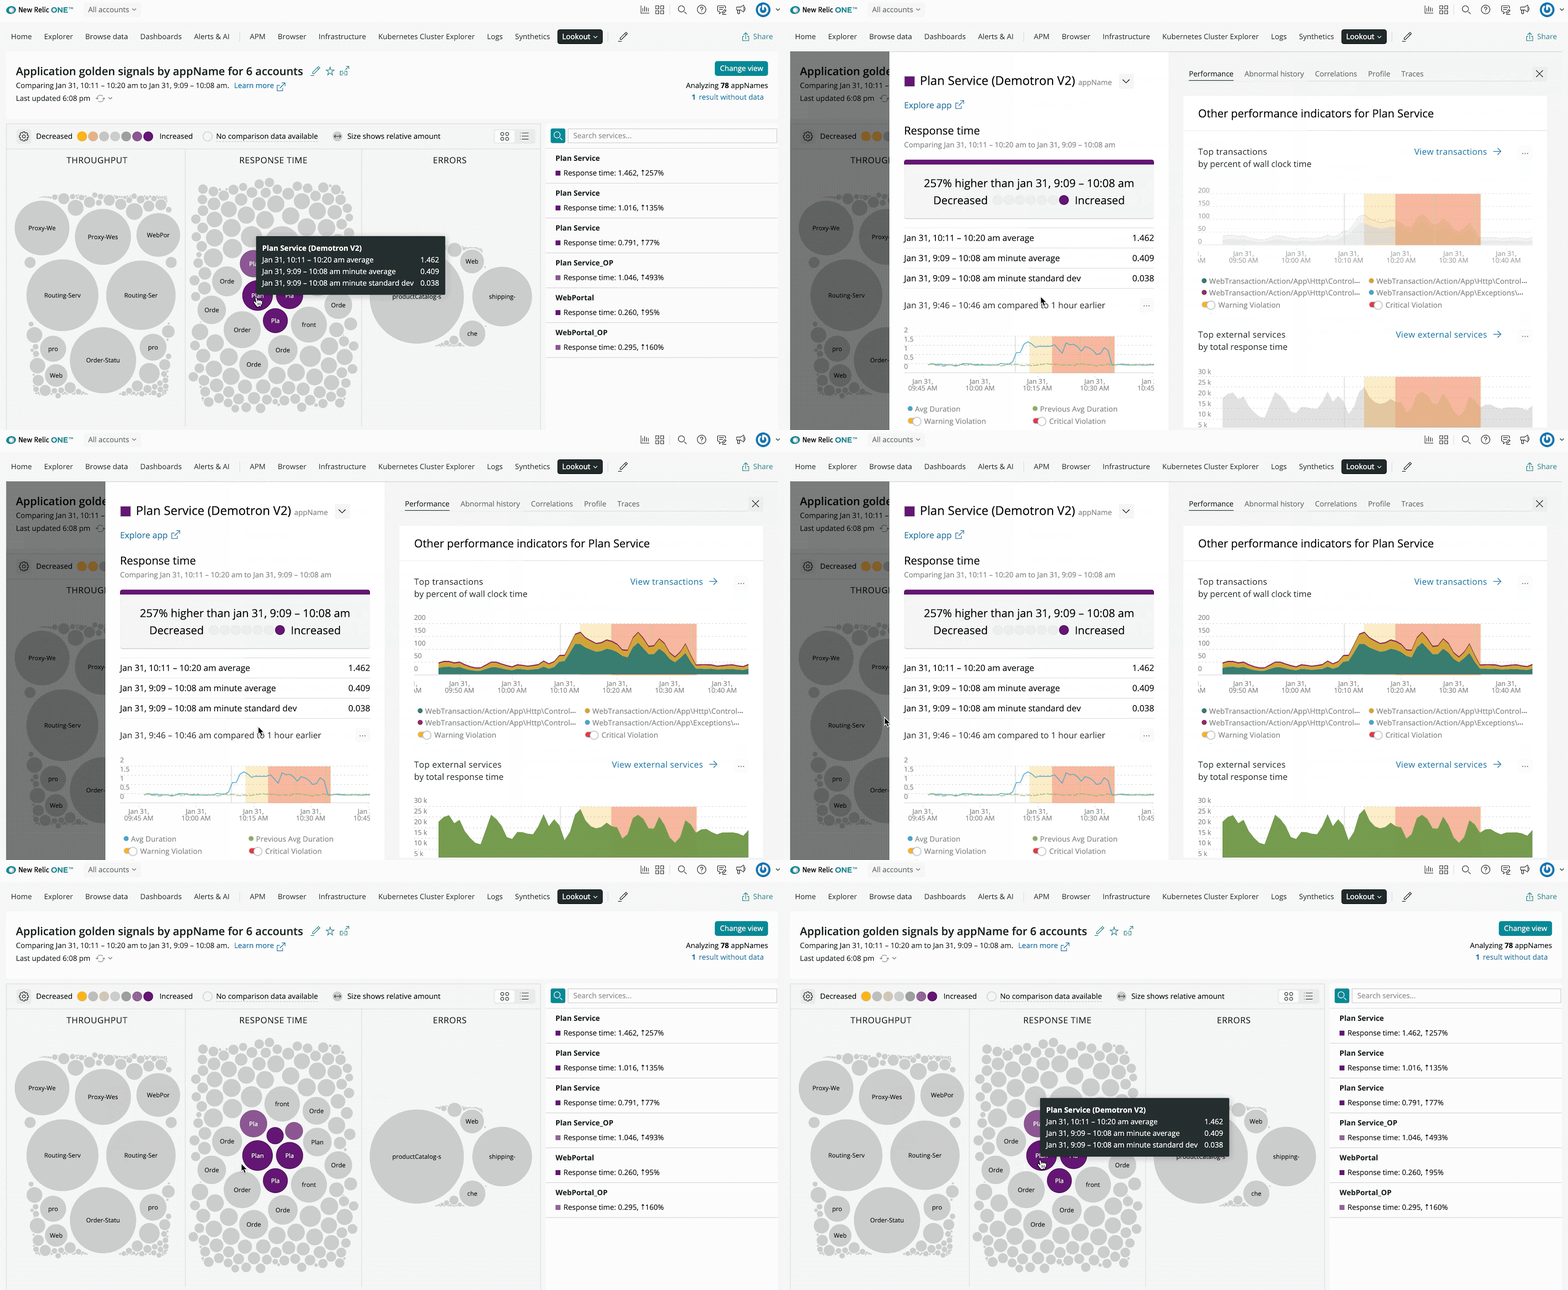
New Relic Lookout provides a real-time view across all your accounts, highlighting changes in all your telemetry, regardless of instrumentation source—even third-party and open source data—in an easy-to-understand, accessible user experience that requires no configuration. An intuitive circle visualization, with color indicating severity of recent changes and size conveying the scale, draws your attention where it’s needed most.

Beyond showing key metrics of throughput, response time, and errors, you can view changes in any signal in your telemetry data that you find important, across all your accounts. You can analyze changes with performance, abnormal history, correlations, traces, and error profiles to quickly uncover blind spots and unknown relationships so you understand what’s changed and why. That way, you can resolve issues before they impact your customers. Get started with Lookout and learn more about Lookout.
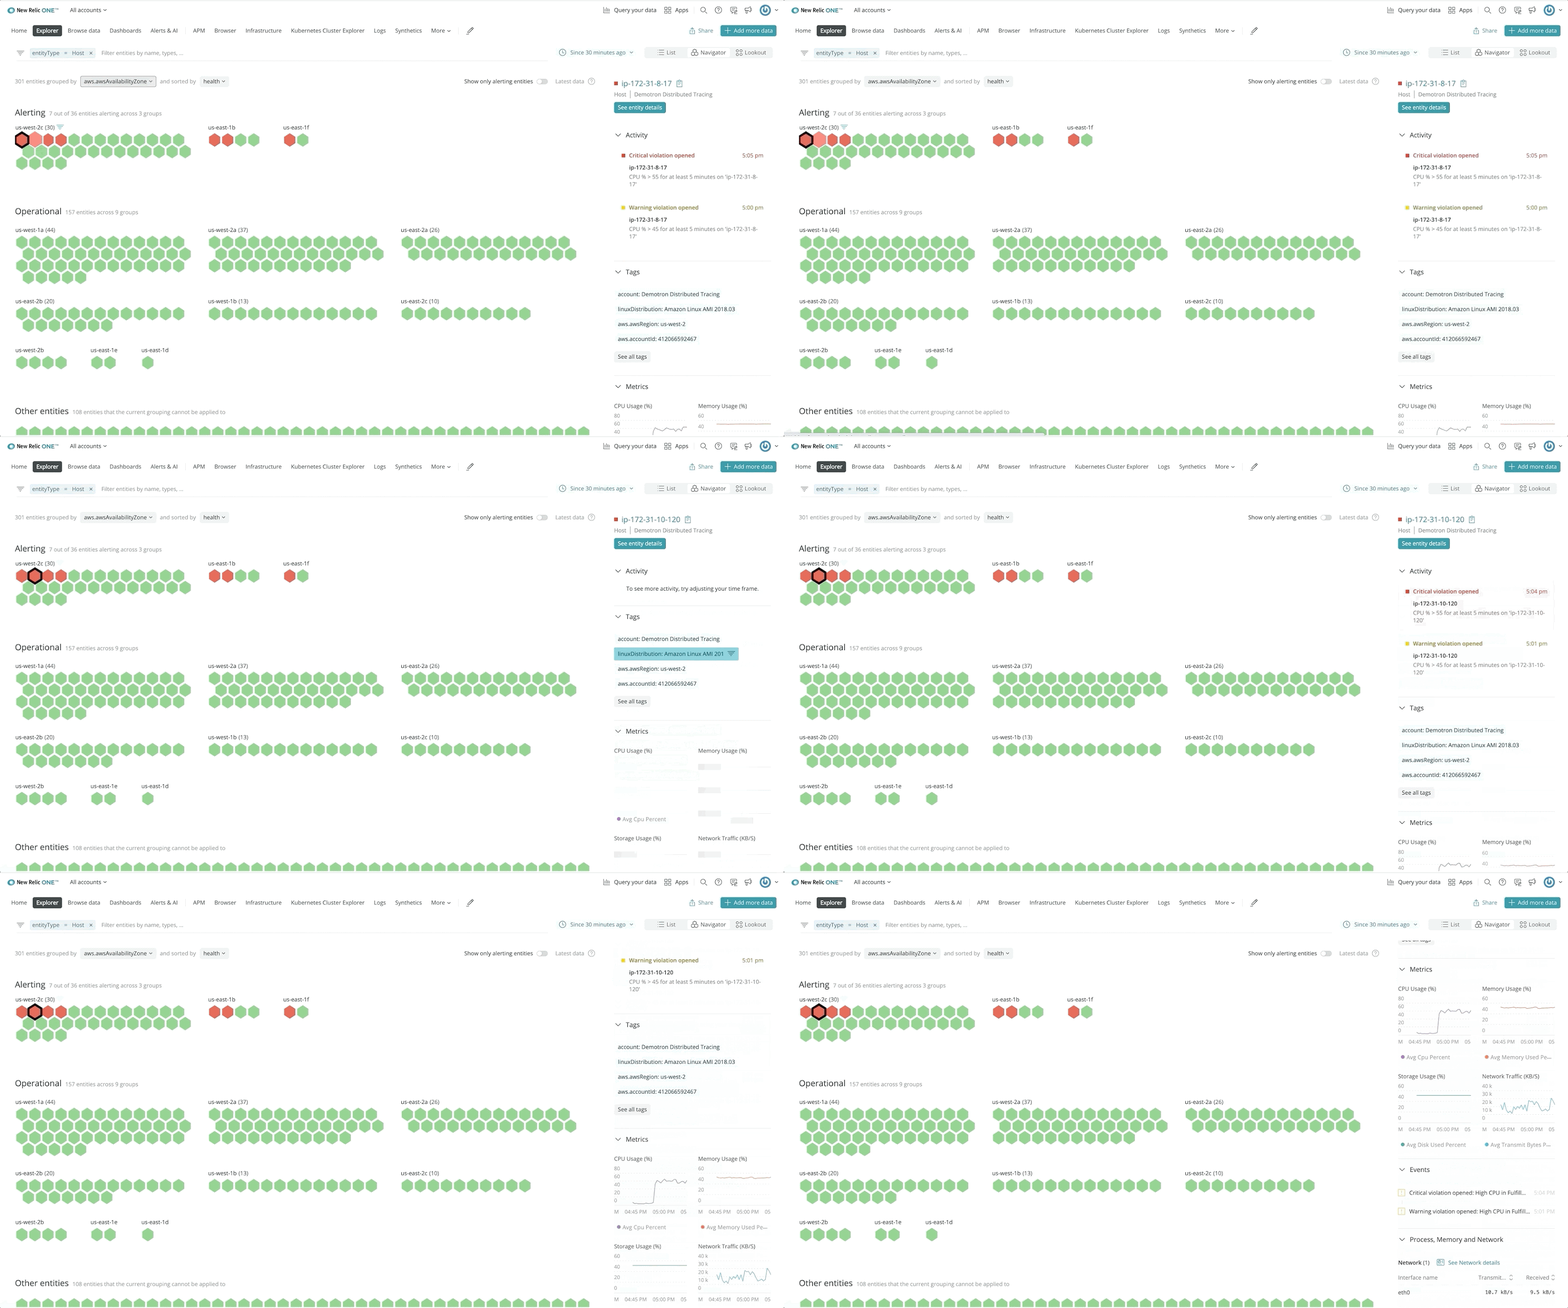
New Relic Navigator also offers an estate-wide view of your system. It filters the view by entities rather than changes, and it displays the health of your estate in a highly dense honeycomb view with traffic-light colors based on alerts so you can quickly explore your entire environment, understand health status, and resolve issues quickly.

New Relic Navigator lets you explore all your entities belonging to all your accounts, focusing on specific entity types or specific groups of entities organized by tags to quickly zero in on issues. When you have thousands, or tens of thousands of hosts, containers, and services, this capability makes it easy for you to explore everything in one place.
Related Entities shows you all the entities related to a specific application, host, container, or integration. It lets you quickly understand which upstream or downstream services are related to an issue, gives you a broader view of the overall health of your system, and helps you troubleshoot issues faster. New Relic automatically detects most relationships, but you can also create your own relationships to make sure that you have the most complete map of your environment.