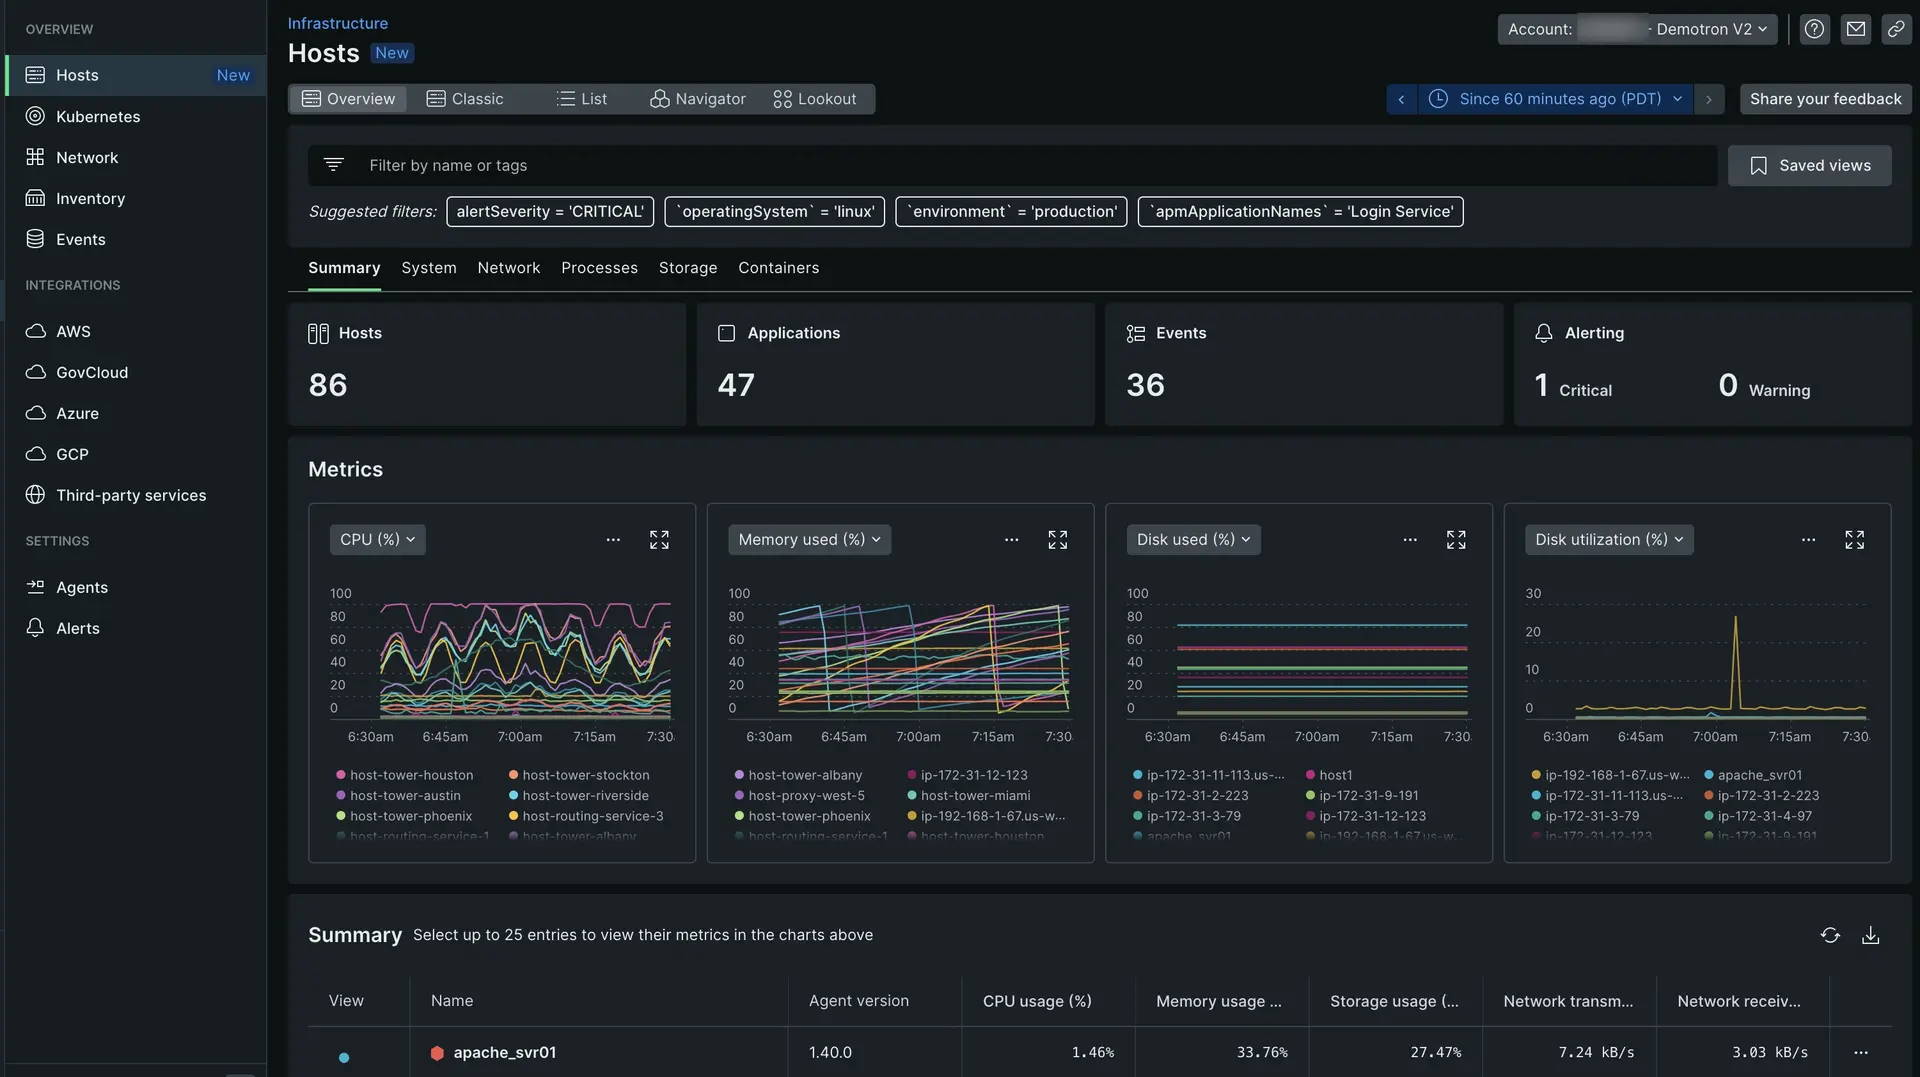
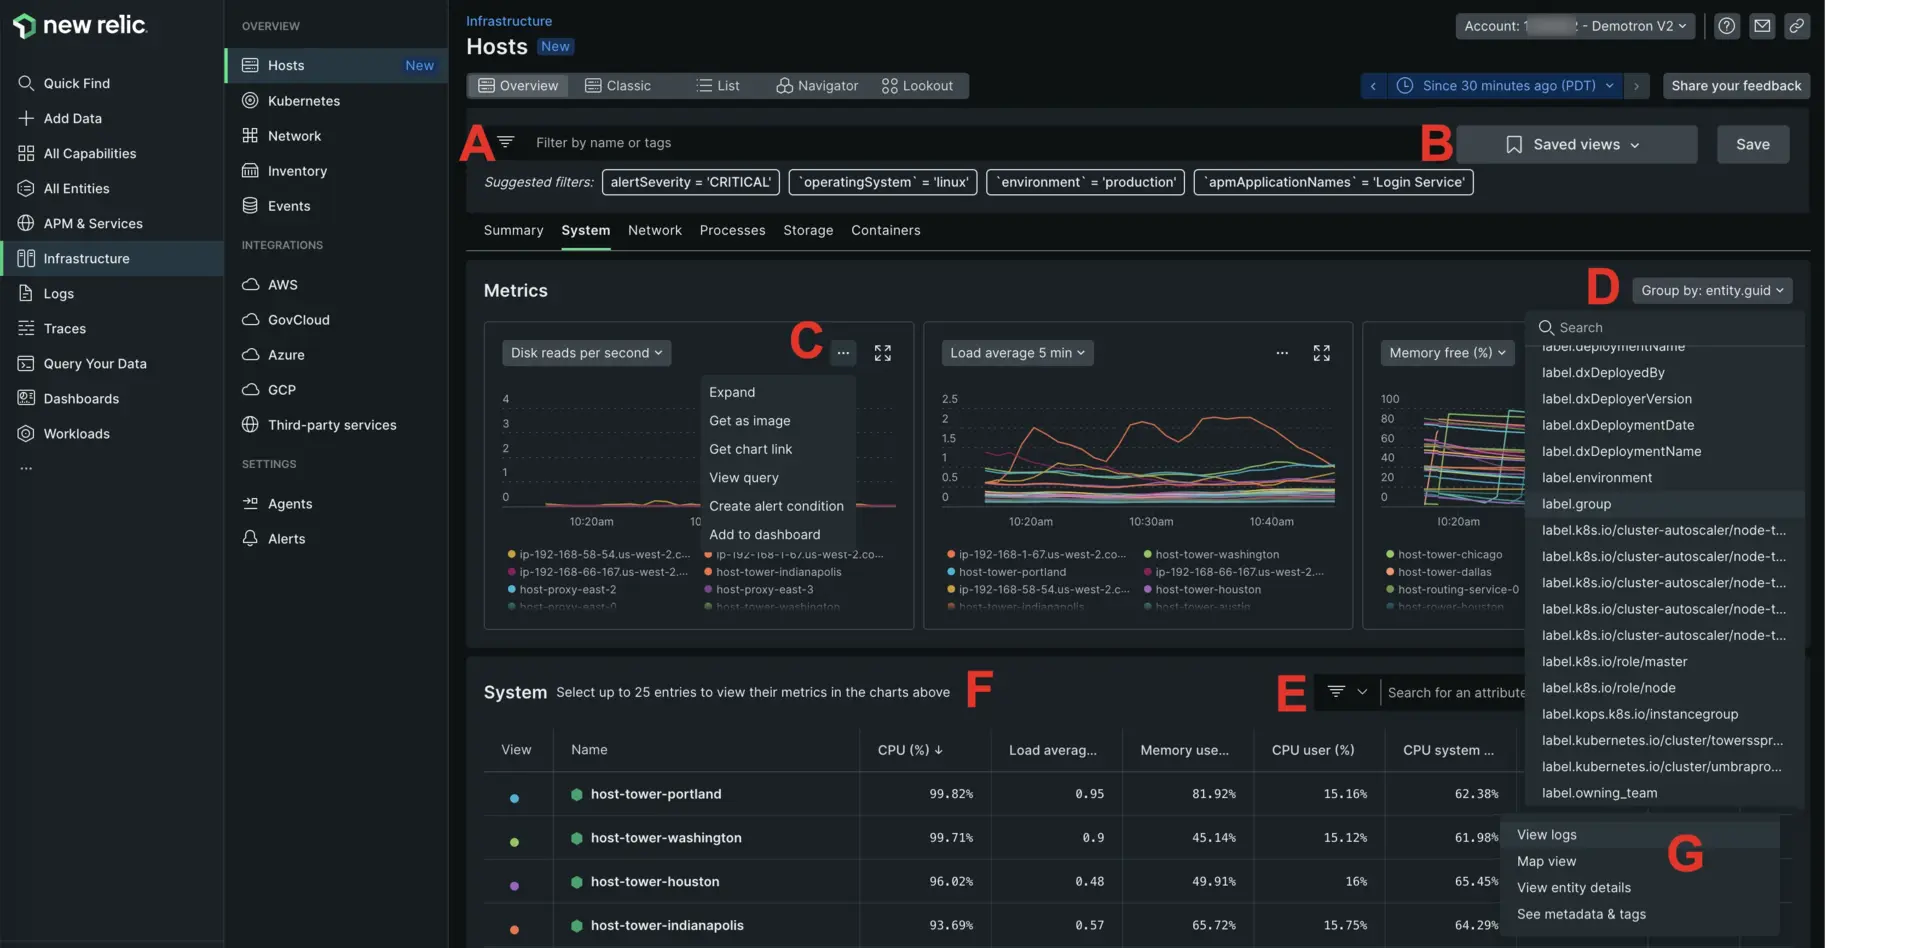
Use the Hosts page to better understand important performance metrics, like resource usage, network and processes performance, and data about your containers. You can filter your hosts by attributes and compare their performance with inventory change events to help determine root causes. You can also set alert notifications to help prevent problems.
To view your hosts information, go to one.newrelic.com > Infrastructure > Hosts, and click the Classic tab. Then, click any of the following tabs:
- System: Overview of your hosts' performance
- Network: Bandwidth and error data about your network interfaces
- Processes: Data about CPU percentage, I/O bytes, and memory usage for individual or groups of processes
- Storage: Resources' capacity and efficiency, including your devices' overall utilization, disk usage, or I/O operations
- Docker containers: CPU percentage, I/O bytes, and memory usage for individual or group of containers
System tab
Here are the default graphs shown on the Hosts page. For additional chart options, select the dropdown for any chart.
- CPU %: On the System tab, CPU Percent is a derived metric that is part of the
SystemSample
event. The CPU percentage is not collected by New Relic, but derived from several other metrics. Specifically, thecpuPercent
attribute is an aggregation ofcpuUserPercent
,cpuSystemPercent
,cpuIoWaitPercent
andcpuStealPercent
. - Load average five minute: represents an average of the number of tasks waiting to do work on a system over the last 5 minutes.
- Memory free %: compares the amount of free memory bytes to the amount of used memory bytes.
For explanations of different chart metrics, see Default infrastructure attributes and events.
Functions for adjusting chart data include:
- Select different host groups: Use the host filter.
- Change time range: Use the time picker above the charts, or drag and select a time range on a chart.
- Change the number of elements on charts: use the Chart shows dropdown.
- Change data used to order hosts: Use the table below the charts to order the chart elements by different metrics; for example, from highest to lowest
CPU user %
to lowest, or from lowest to highestDisk free
.
System tab functions
Here are some of the things you can do from the System tab:
If you want to... | Do this... |
---|---|
Filter and group hosts | Use filter sets to show only hosts matching certain criteria, or use group by to aggregate the results. |
Understand host health | Use the Health column of the table. To see more details about specific violations, select the health status icons. |
Find root causes of issues | Use the Events heatmap at the top of the page to compare performance to important events happening in your infrastructure. For more, see Events heatmap. |
Set an alert condition for a metric | Mouse over a chart, select and then Create alert. |
View host's alert threshold violation | If present, select the host's Critical icon or Warning icon. |
APM and infrastructure data
If you have data associated with your infrastructure data, there are several ways to access your APM data on the Hosts page:
- Use the hosts filter to filter on hosts running specific applications.
- In the host list below the charts, select the Application column to filter on specific applications.
- From the chart selector dropdown beside a chart's name, select one of the application-related charts.
Importante
charts in infrastructure monitoring do not have View query or Create alert options like the other infrastructure charts do.
For more about using and infrastructure monitoring together, see APM data in infrastructure.
Network tab
The Network page provides real-time visibility into the health and performance of individual hosts, web servers, or other groups of resources across your network. Default charts show bandwidth metrics by packet, bandwidth by bytes, and errors per second.
Details about individual interfaces can help you:
- Examine saturation levels across your network or for selected filter sets.
- Compare load balances between specific resources.
- Identify unexpected differences in capacity patterns between similar hosts.
- Evaluate the top five network errors that New Relic automatically presents for the selected time period.
This real-time network data can then help you determine whether to resolve errors by reconfiguring your network, rebalancing the loads, or taking other preventative maintenance actions before needing to make a purchase decision.
From the Network tab you can view bandwidth and error data about your network interfaces. The Network page includes an Events heatmap, which provides a snapshot of the events occurring within the same time range as the displayed metrics.
For a technical explanation of the attributes used to populate the Network page chart, see NetworkSample attributes.
Network tab functions
Here are some of the things you can do from the Network tab:
If you want to... | Do this... |
---|---|
Filter and group | Use filter sets to show only hosts matching certain criteria, or use Group by to aggregate the results. |
Select a time range | Use the time picker to change the range of time selected. You can also click and drag on the chart to select a custom time range. When you select a time range, it carries over when you go from one infrastructure page to another. |
Change metrics displayed in chart | Use the sorting dropdown to switch what metric the chart is displaying for the chosen process groupings, including:
|
Search and filter the list | Type in the Search interfaces search bar to filter the list to only those items containing the text you've typed. You can also filter the list by simply selecting the list item or user name you want to filter for. The chosen filters are displayed beside the filter icon above the chart. |
Add items to chart | The chart, by default, displays the top five results. Use the Chart shows dropdown to display more results. To remove an item from a chart, select its name below the chart. |
Set an alert condition for a metric | Mouse over a chart, select and then Create alert. (Not available on APM charts.) |
View host's alert threshold violation | Select the host's Critical icon or Warning icon. |
Processes tab
Importante
By default, the infrastructure agent doesn't send data about the operating system's processes unless you use the guided install. To enable the sending of process data set enable_process_metrics
to true
. To fine-tune which processes you want to monitor, configure include_matching_metrics
or exclude_matching_metrics
.
Use the Processes tab to get information about processes running on your hosts, and to set alerts on process metrics. The Processes tab shows data such as CPU percentage, I/O bytes, and memory usage for individual processes or groupings of processes.
The page also includes an events heatmap, which provides a snapshot of the events occurring within the same time range as the displayed metrics. Use this information to:
- Pinpoint processes that are causing performance issues.
- Create alerts for conditions such as CPU percentage and memory usage.
On the Processes page, CPU percent is scoped to individual processes, rather than hosts. Because of this, the CPU percent metric does not take into account the resources of the entire system. Instead, it shows how much of a single CPU core each process is taking.
Example
Here's an example of how to pinpoint an issue and set an alert:
- You notice on the Hosts page that a cluster has a CPU percentage much higher than normal.
- You go to the Processes page and filter down to that cluster's processes.
- You notice that several instances of the same process have excessive CPU percentage.
- After fixing the issue, you decide to create an alert condition that triggers when the CPU percentage for that process type exceeds a certain threshold.
For a technical explanation of the attributes used to populate the Processes page chart, see ProcessSample attributes.
Dica
You cannot start, stop, or restart processes from the UI. Instead, follow standard procedures to start, stop, check, or restart the infrastructure agent manually.
Processes tab functions
Here are some of the things you can do from the Processes tab:
If you want to... | Do this... |
---|---|
Only show hosts matching certain criteria | Use filter sets. |
Aggregate results or group by host attributes | Use Group by to change how the processes are grouped in the chart and the list. The dropdown contains host-related attributes such as |
Select a time range | Use either of these options:
|
View Docker metrics | To view process usage by Docker containers, see Docker instrumentation. |
Change charts | Select the dropdown beside the chart's name to switch what metric the chart displays. Choices include:
|
Search and filter the list | Use either of these options:
|
Set an alert condition for a metric | Mouse over a chart. Select and then Create alert. (Not available on APM charts.) |
View host's alert threshold violation | Select the host's Critical icon or Warning icon. |
Storage tab
The Storage page allows you to monitor your resources' capacity and efficiency, including your devices' overall utilization, disk usage, or I/O operations. This can help you to:
- Examine unexpected patterns; for example, a cluster of mirrored machines that do not process I/O tasks uniformly.
- Monitor usage levels before disk space completely runs out.
- Set alert conditions to notify you about problems with one or more hosts; for example, long processing times for read or write operations, disk availability or utilization based on percentage or bytes, etc.
- Make informed decisions about where to redistribute hosts with higher or lower than normal processing requests.
- Use data to help plan for additions or changes to your infrastructure budget before an emergency arises.
The Storage page includes an Events heatmap, which provides a snapshot of the events occurring within the same time range as the displayed metrics.
For a technical explanation of the attributes used to populate the Storage page chart, see StorageSample attributes.
Storage tab functions
Here are some of the things you can do from the Storage tab:
If you want to... | Do this... |
---|---|
Filter and group | Use filter sets to show only hosts matching certain criteria, or use Group by to aggregate the results. |
Select a time range | Use the time picker on the upper right to change the range of time selected. You can also click and drag on the chart to select a custom time range. When you select a time range, it carries over when you go from one infrastructure page to another. |
Change metrics displayed in chart | Use the sorting dropdown to switch what metric the chart is displaying for the chosen process groupings. Choices include:
|
Search and filter the list | Type in the Search devices search bar to filter the list. You can also filter the list by simply selecting the list item or user name you want to filter for. The chosen filters are displayed beside the filter icon above the chart. |
Add/remove chart items | The chart, by default, displays the top five results. Use the Chart shows dropdown to display more results. To remove an item, select its name below the chart. |
Set an alert condition for a metric | Mouse over a chart. Select and then Create alert. (Not available on APM charts.) |
View host's alert threshold violation | Select the host's Critical icon or Warning icon. |
Docker containers tab
Use the Docker containers tab to get information about the containers running on your hosts, and to set alerts on container metrics. The Docker containers tab shows data such as CPU percentage, I/O bytes, and memory usage for individual containers or groupings of containers.
The page also includes an events heatmap, which provides a snapshot of the events occurring within the same time range as the displayed metrics. Use this information to:
- Identify containers that are experiencing performance issues.
- Create alerts for conditions such as CPU percentage and memory usage.
Docker containers tab functions
Here are some of the things you can do from the Docker containers tab:
If you want to... | Do this... |
---|---|
Only show hosts matching certain criteria | Use filter sets. |
Aggregate results or group by host attributes | Use Group by to change how the processes are grouped in the chart and the list. The dropdown contains host-related attributes such as |
Select a time range | Use either of these options:
|
View Docker integration dashboard | To open the Docker integration dashboard, click the Dashboard link above the data table. |
Change charts | Select the dropdown beside the chart's name to switch what metric the chart displays. Choices include:
|
Search and filter the list | Use either of these options:
|
Set an alert condition for a metric | Mouse over a chart. Select and then Create alert. |
View host's alert threshold violation | Select the host's Critical icon or Warning icon. |