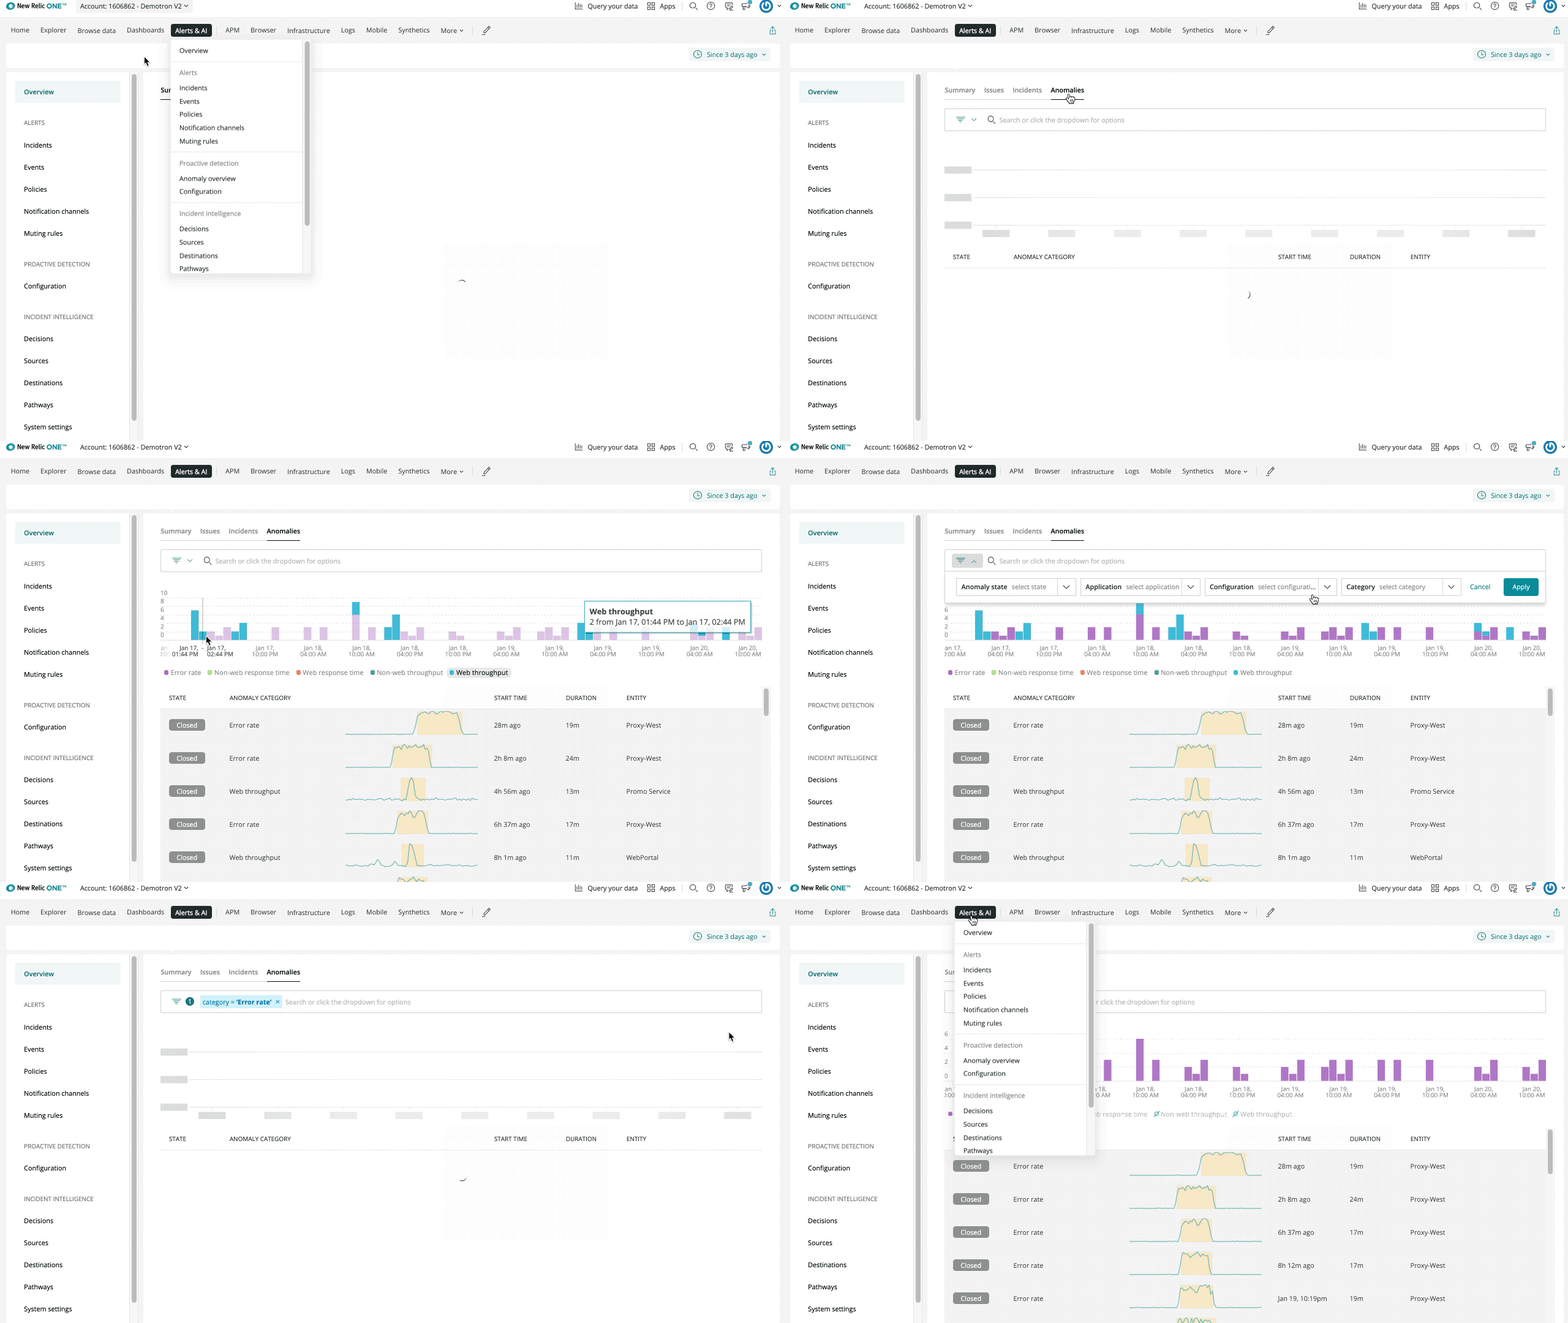
With the new Anomalies tab in the consolidated Applied Intelligence Overview, you can now view all your anomalies in one place to quickly gain a sense of the state of your system. You’ll see Anomalies alongside Issues and Incidents.

A demo of how to explore system anomalies from Alerts & AI > Overview in New Relic One.
In this new tab you can quickly focus on the areas that matter most to you with easy filtering by state, application name, config name, or anomaly type. You can even select an area of the stacked bar chart to filter to a specific time window to see the state of your system's anomalies.
To see and explore the anomalies in your system, navigate to Overview within Alerts & AI, then head to the Anomalies tab.