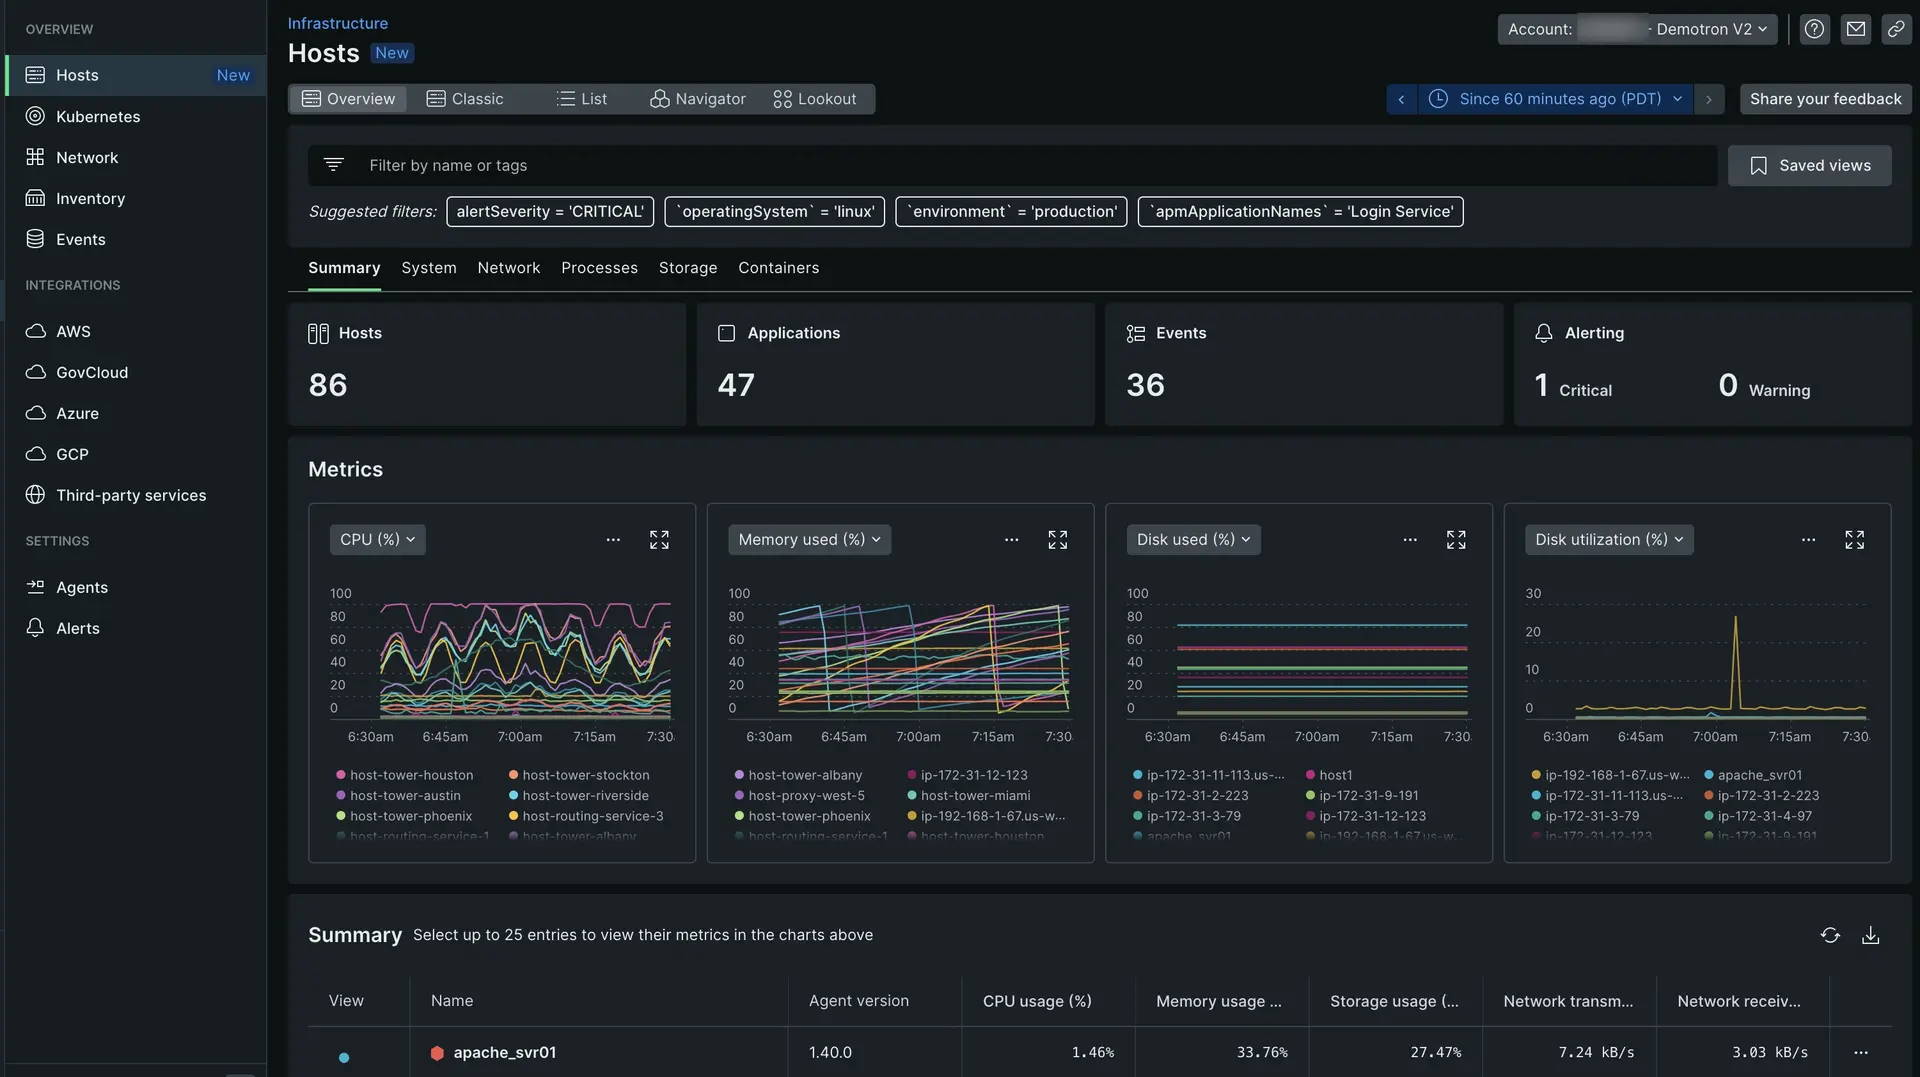
Our 2022 relaunch of the infrastructure monitoring tools adds consistency to the way our users interact with the our platform.
Previously, when navigating to infrastructure, you were redirected outside the Explorer, missing capabilities like the Navigator and Lookout. Now, by clicking on infrastructure or hosts, you are directed to the list of all of our host entities in the list view of Explorer, and infrastructure events are displayed in the activity stream. Our inventory experience has not changed as part of this release.
Learn more about our new infrastructure monitoring feature with a short video (6:07 min.):
Ready to get started? Make sure you have a New Relic account. It's free, forever!
Access the Infrastructure Entities page
Go to one.newrelic.com > Infrastructure, then click Hosts (New). Or go to the Explorer and select Hosts.
The infrastructure Explorer list view is organized in these panels:
Your system's entities on the left.
Estate View panel in the middle.
- It provides the ability to select up to 25 entities at a time to analyze together: Select the hosts you want to observe, and hit the View Selected button to navigate to the new analysis nerdlet.
- From the list view you can still jump directly to an individual entity summary by clicking on the entity name in the list.
- Click the ... at the right end of any entity to see the entity's tags and other related information.
- Activity stream on the right.
팁
Use the toggle in the UI to access the legacy interface.
While we have worked to update the flow and visualizations around your key infrastructure data, we have not removed any of the previous functionality in order to give you time to adjust to the new tools. You can still access the hosts legacy view from the top infrastructure nav drop down.
Entities are displayed based on golden metrics
The new entity list is powered by golden metrics, which you are starting to see throughout New Relic. You will see the same set of metrics if you select to view Lookout for these infrastructure entity types. These new metrics replace the previous summary metrics in the old UI.
Views with improved sorting and filtering
We have removed the limitation of fewer than 2,000 entities to sort column values. Note that performance may be slightly impacted if there are more than 10,000 entities.
On top of sorting, you can also filter the entities' metric values to hone in on exactly the entities that need your attention. For example, you can now filter only to entities that have a CPU over 80% so you can quickly identify if there are problems in their estate. Filtering is limited to one column for the moment, but it will be extended to multiple columns in future releases.
Dive deep into your hosts with the new analysis nerdlet
Once you've selected the desired entities in the entity list view, upon clicking View Selected, a slide-out analysis panel appears regarding that set of entities.
You'll have four tabs to explore your data:
팁
Use the time picker to change the range of time selected. When you select a time range, it carries over when you go from one infrastructure page to another.
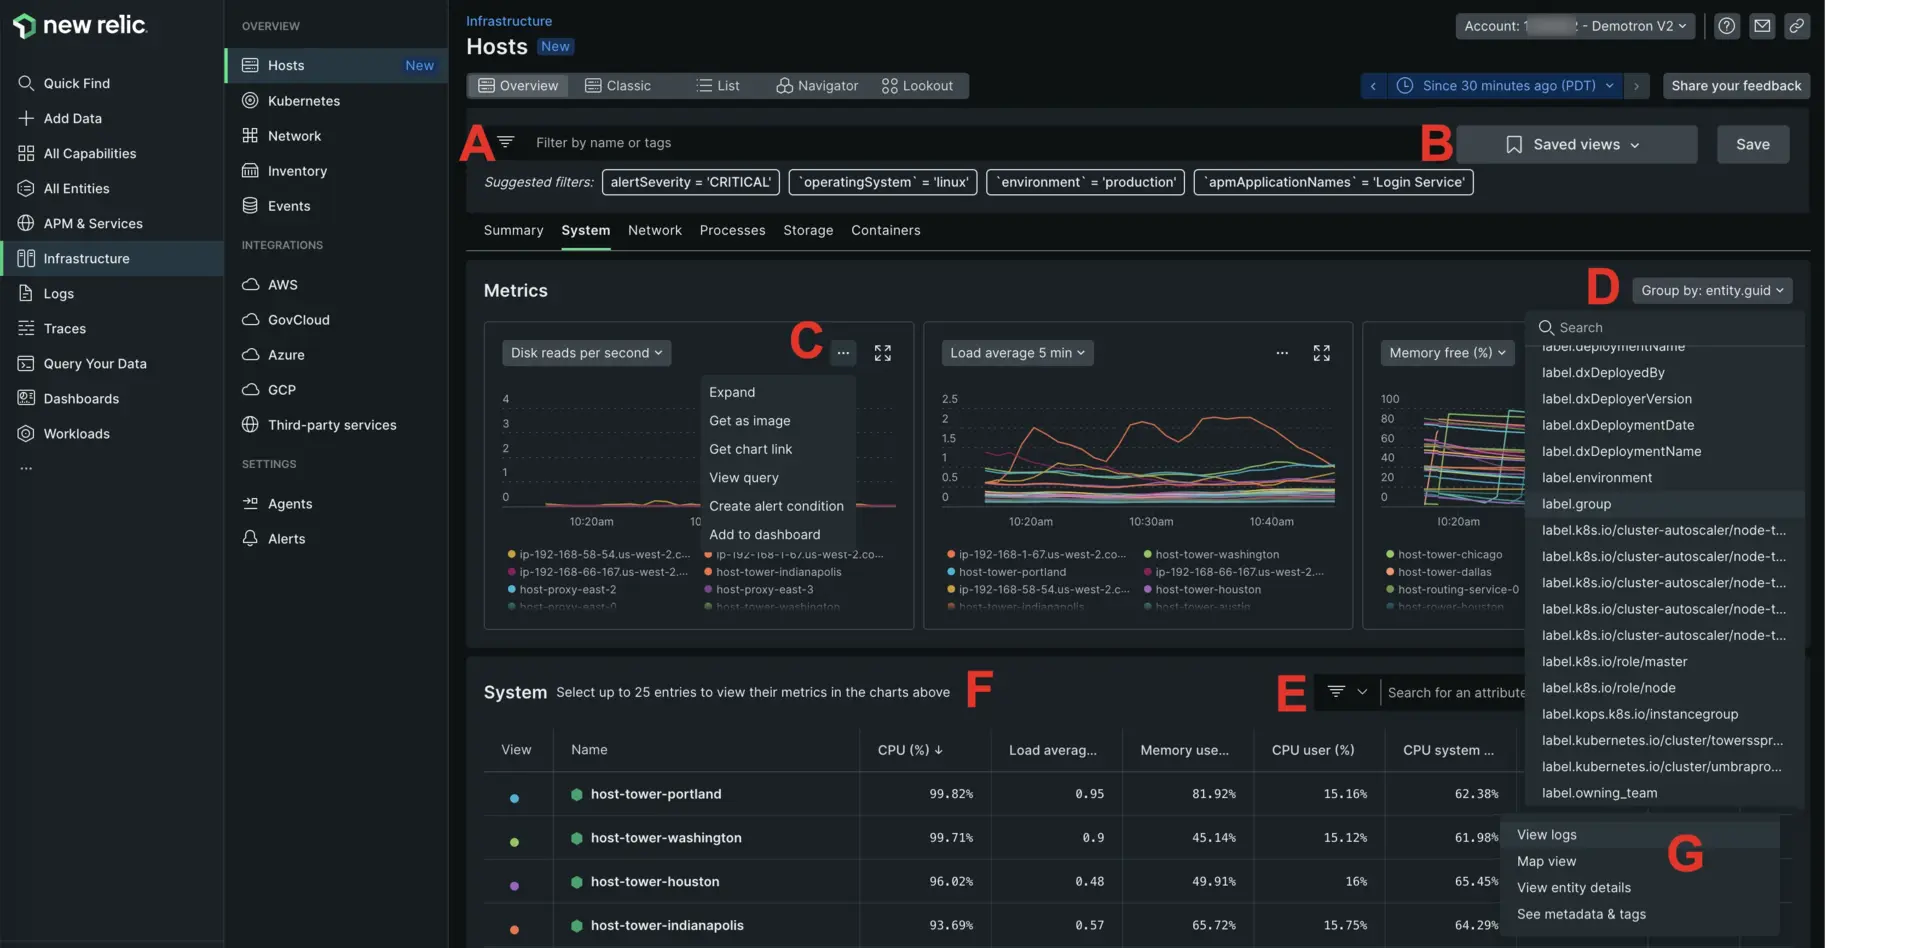
System tab
The system tab has three panels.
Left panel: Selected entities list
Toggle between these entities' key metrics on the top drop down.
Hover over any entity row to view more details on the entity.
Click See logs to open a new tab with their logs in context information. To enable logs, see our docs on log management. You can jump back to the tab with your hosts analysis panel still in place.
For hosts only, use the map icon to launch the auto-map feature for a particular host entity. This view gives you a visual representation of your host's relationships to other entities in the stack.
- Select the magnifying glass icon labeled View host to be redirected to the summary page for that individual entity.
- If you select an entity in the left panel, the line for that entity will also be highlighted on each chart.
- Hide the entity from the list clicking on the eye icon. If you chose to hide entities in the left panel, those will be removed from the charts in the middle panel.
Middle panel: Golden metrics comparison charts
The golden metrics comparison charts represent the golden metrics signals for the selected entities. Default charts include CPU usage, memory usage, storage usage, network transmit traffic, and network receive traffic.
To maximize your analysis:
- If you chose to hide entities in the left panel, they will be removed from the charts.
- If an entity is highlighted in the left panel, the line for that entity will also be highlighted on each chart. Or, if you highlight a line, the entity is also highlighted on the left.
- Check details for data points on each chart hovering over the tooltip.
Right panel: Related entities
Understanding relationships in New Relic can be complicated, but very powerful when trying to solve problems. Imagine a host is misbehaving and you'd like to know, without a lot of clicking, what else it might be affecting. The related entities panel seeks to show you those entities that are related to your selection on the left panel so you can see common golden signals on those entities. See at a glance if your connected service is experiencing a slow response time, decreased throughput or an elevated error rate!
- When you first enter the new view, you will see the related entities panel sorted by the alert status of those entities. If there's a service with a critical violation, it will be right at the top!
- If you hover on an entity in the left panel, the related entities associated with the item will be highlighted on the right. Additionally, if you click on the item in the left side, the right panel will re-sort to bump the associated related entities to the top of the column on the right.
Network tab
The Network tab provides real-time visibility into the health and performance of individual resources across your network. Default charts show transmit bytes, transmit errors, transmit packets, and a list of the entities and their interface information.
Details about individual interfaces can help you:
- Compare load balances between specific resources.
- Identify unexpected differences in capacity patterns between similar hosts.
- Evaluate the top five network errors that New Relic automatically presents for the selected time period.
This real-time network data can then help you determine whether to resolve errors by reconfiguring your network, rebalancing the loads, or taking other preventative maintenance actions before needing to make a purchase decision.
Processes tab
중요
By default, the infrastructure agent doesn't send data about the operating system's processes unless you use guided install. To enable the sending of process data set enable_process_metrics
to true
. To fine-tune which processes you want to monitor, configure include_matching_metrics
or exclude_matching_metrics
.
Use the Processes tab to get information about processes running on your hosts, and to set alerts on process metrics. The Processes tab shows data such as CPU percentage, I/O bytes, and memory usage for individual processes or groupings of processes.
For a technical explanation of the attributes used to populate the Processes page chart, see ProcessSample attributes.
팁
You cannot start, stop, or restart processes from the UI. Instead, follow standard procedures to start, stop, check, or restart the infrastructure agent manually.
Storage tab
The Storage tab allows you to monitor your resources' capacity and efficiency, including your devices' overall utilization, disk usage, or I/O operations. This can help you to:
- Examine unexpected patterns; for example, a cluster of mirrored machines that do not process I/O tasks uniformly.
- Monitor usage levels before disk space completely runs out.
- Set alert conditions to notify you about problems with one or more hosts; for example, long processing times for read or write operations, disk availability or utilization based on percentage or bytes, etc.
- Make informed decisions about where to redistribute hosts with higher or lower than normal processing requests.
- Use data to help plan for additions or changes to your infrastructure budget before an emergency arises.
For a technical explanation of the attributes used to populate the Storage page chart, see StorageSample attributes.