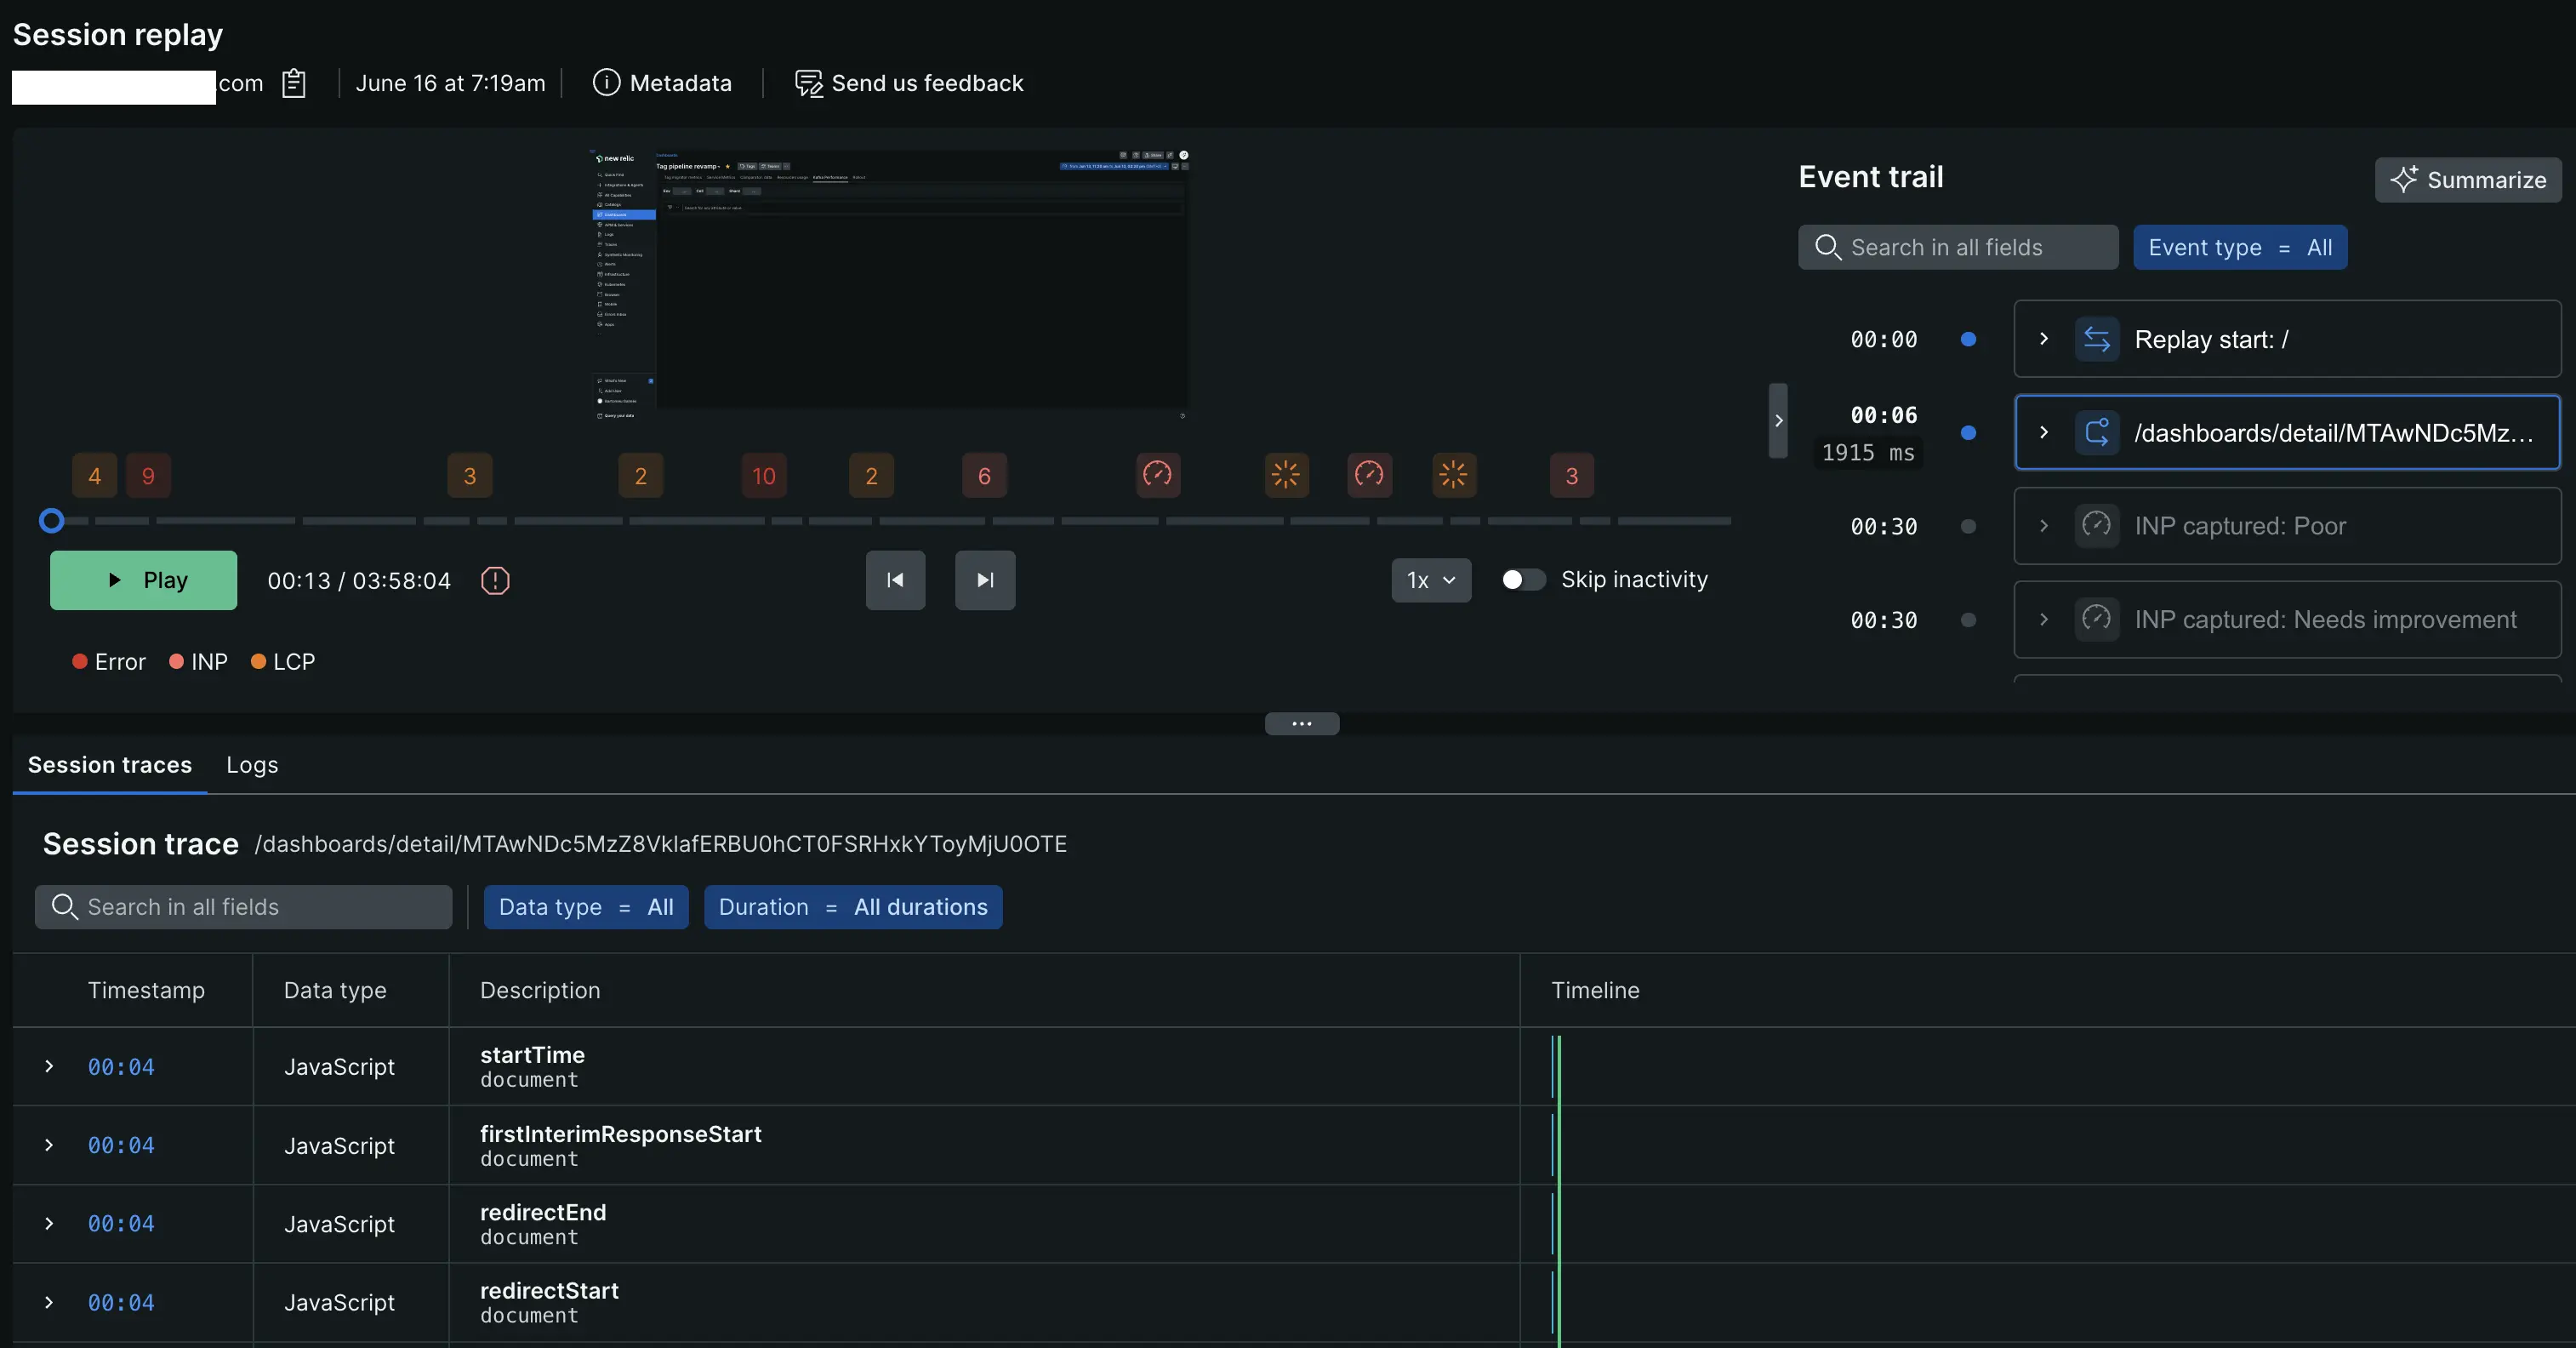
We're excited to announce significant enhancements to our session replay player, designed to provide richer insights into user experience and performance issues. These updates introduce visual markers for critical events, improved filtering, and a full-screen viewing option, empowering you to quickly pinpoint and address user friction points.

Enhanced session replay player
We've rolled out powerful updates to the session replay player, making it easier than ever to identify, analyze, and resolve user experience and performance problems.
Key changes:
-
Visual error markers: Red markers now appear directly on the replay timeline slider, instantly highlighting when JavaScript errors occurred during the user's journey.
-
Core web vitals indicators:
- Largest Contentful Paint (LCP) issues: Orange markers on the timeline pinpoint moments where LCP performance struggled.
- Interaction to Next Paint (INP) performance: A dedicated icon indicates instances of INP performance issues, helping you target interaction bottlenecks.
-
Smart issue aggregation: When multiple performance issues occur at the same timestamp, we now display a convenient count badge on the marker. Hover over the marker to see a complete list of all metrics and issues recorded at that specific moment.
-
Filtered view of visual markers: A new filtering mechanism allows you to selectively view these visual markers. This enables more focused analysis, helping you cut through the noise and concentrate on the most relevant performance or error events.
-
"Active Sessions" indicator: The session replay listing and player view now clearly indicate "Active Sessions." This means the last recorded user activity occurred within the past 30 minutes, allowing you to quickly identify current Browser users or those who recently completed their session. This offers immediate insights into the most current user behavior. Note that in the default 30-minute time window, most or all displayed sessions may appear as Active. To see a mix of active and completed sessions, expand your time range using the date/time filters.
-
Full screen mode: Session replays can now be viewed in full-screen mode, providing better visibility and a more immersive experience for detailed analysis of user interactions.
Benefits:
- Quickly pinpoint performance pain points and JavaScript errors: Visual markers make it effortless to spot issues on the timeline.
- Filter noise and focus on relevant sessions: New filtering options help you concentrate on what matters most.
- Get a holistic view of real-time user issues: Combined markers and smart aggregation offer comprehensive insights.
- Improve collaboration across teams with richer context: Share replays with precise visual cues to streamline communication.
Who's affected:
If you use Session Replay, you'll immediately benefit from these visual enhancements. The new markers and indicators appear automatically on existing and new session recordings. If you're analyzing high-traffic applications, the filtering and grouping features will be particularly valuable for efficient issue triage and faster problem resolution.