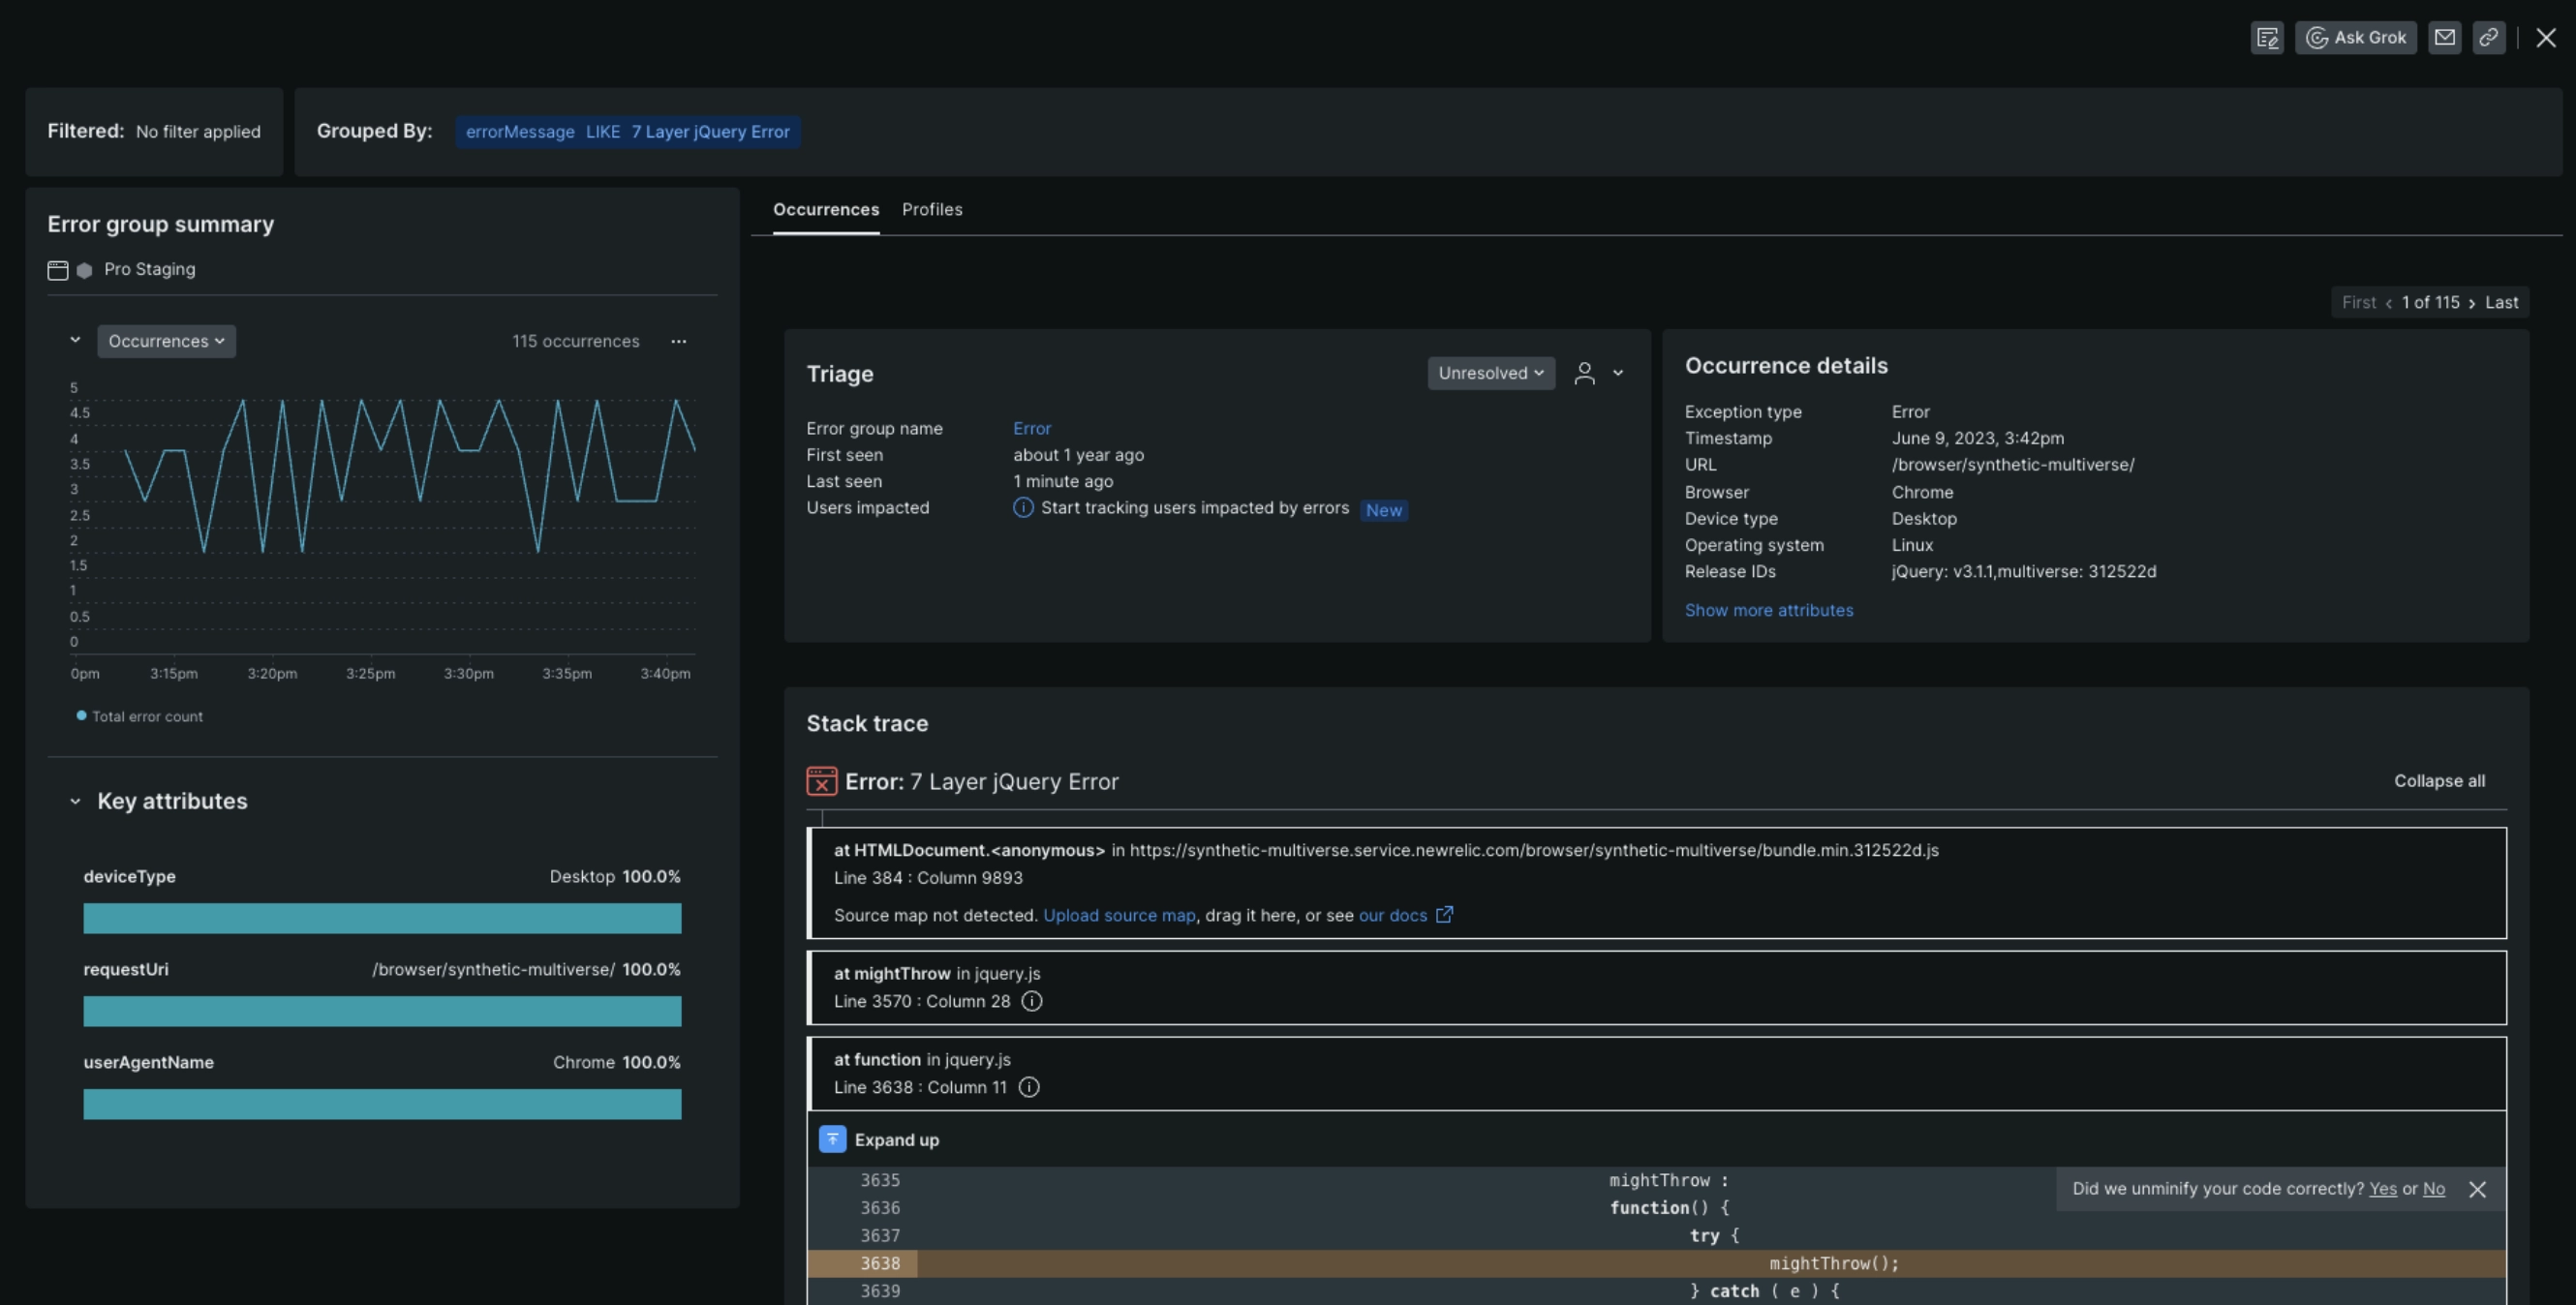
We’ve given the browser experience a whole new look and feel that connects your error analysis and triage workflow and accelerate error resolution before it severely affects your customers. With this new experience, you’ll get:
-
Deeper insights into your errors with stack traces & event trails: You can now upload source maps and access event trails to gain a clearer understanding of the error and what actions led to the error.
-
Data filtering and discovery capabilities for comprehensive data analysis: You can now slice and dice your data to conduct a more thorough analysis of errors that occur. Updates include:
- Ability to filter by attributes
- Error group summaries at the dynamic group level
- Easily viewable and downloadable attributes via Error profiles
-
Seamless transition from analysis to triage to act on errors with confidence and speed. Each individual error occurrence is now connected to the static error group it belongs for faster triaging.

How to get started
- Check out our documentation on Browser: Group errors tab