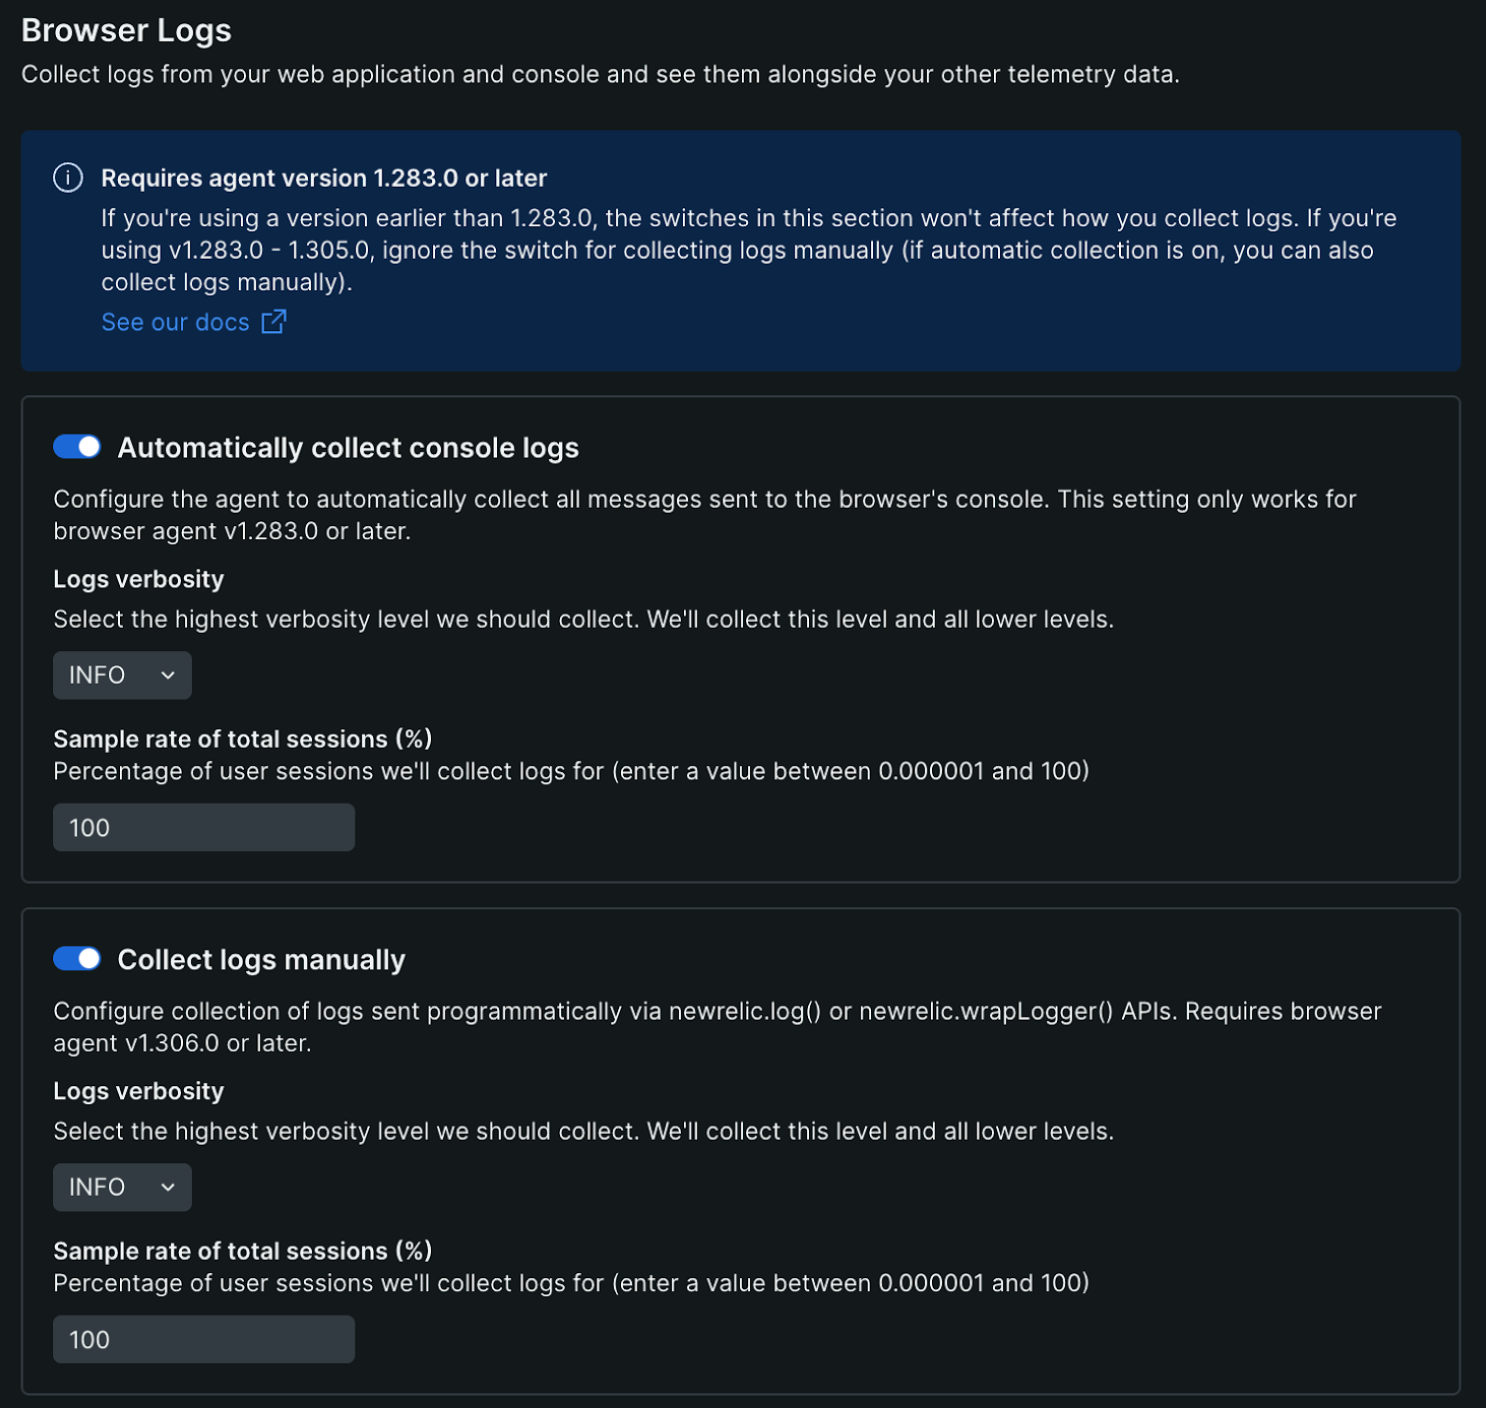
We're excited to announce decoupled browser logs configuration. This new capability allows you to independently manage console logs and manual logs, giving you precise control over what data you collect and how much you spend on browser observability.
What is decoupled browser logs configuration?
Decoupled browser logs configuration gives you separate controls for the two types of browser logs:
- Console logs: Automatic console logs captured from your application
- Manual logs: Custom logs you've instrumented through the New Relic API
You can now enable, disable, and configure verbosity and sampling for each log type independently, allowing you to optimize your browser observability strategy without compromising on the data that matters most to your team.

Why decoupled browser logs configuration?
Effective browser monitoring requires the right balance between visibility and cost. With decoupled browser logs configuration, you can:
- Stop paying for noise: Reduce or disable high-volume console logs from third-party libraries while keeping the custom logs that matter to your team.
- Debug without compromise: Temporarily capture verbose console logs during troubleshooting without changing your production manual logging strategy.
- Tailor your strategy: Set different sampling rates and verbosity levels for each log type based on your specific needs and budget.
Get started
Decoupled browser logs configuration is available on agent version 1.306.0 and above. Navigate to your application settings to configure console and manual logs independently.