Background
Our customers are faced with these challenges:
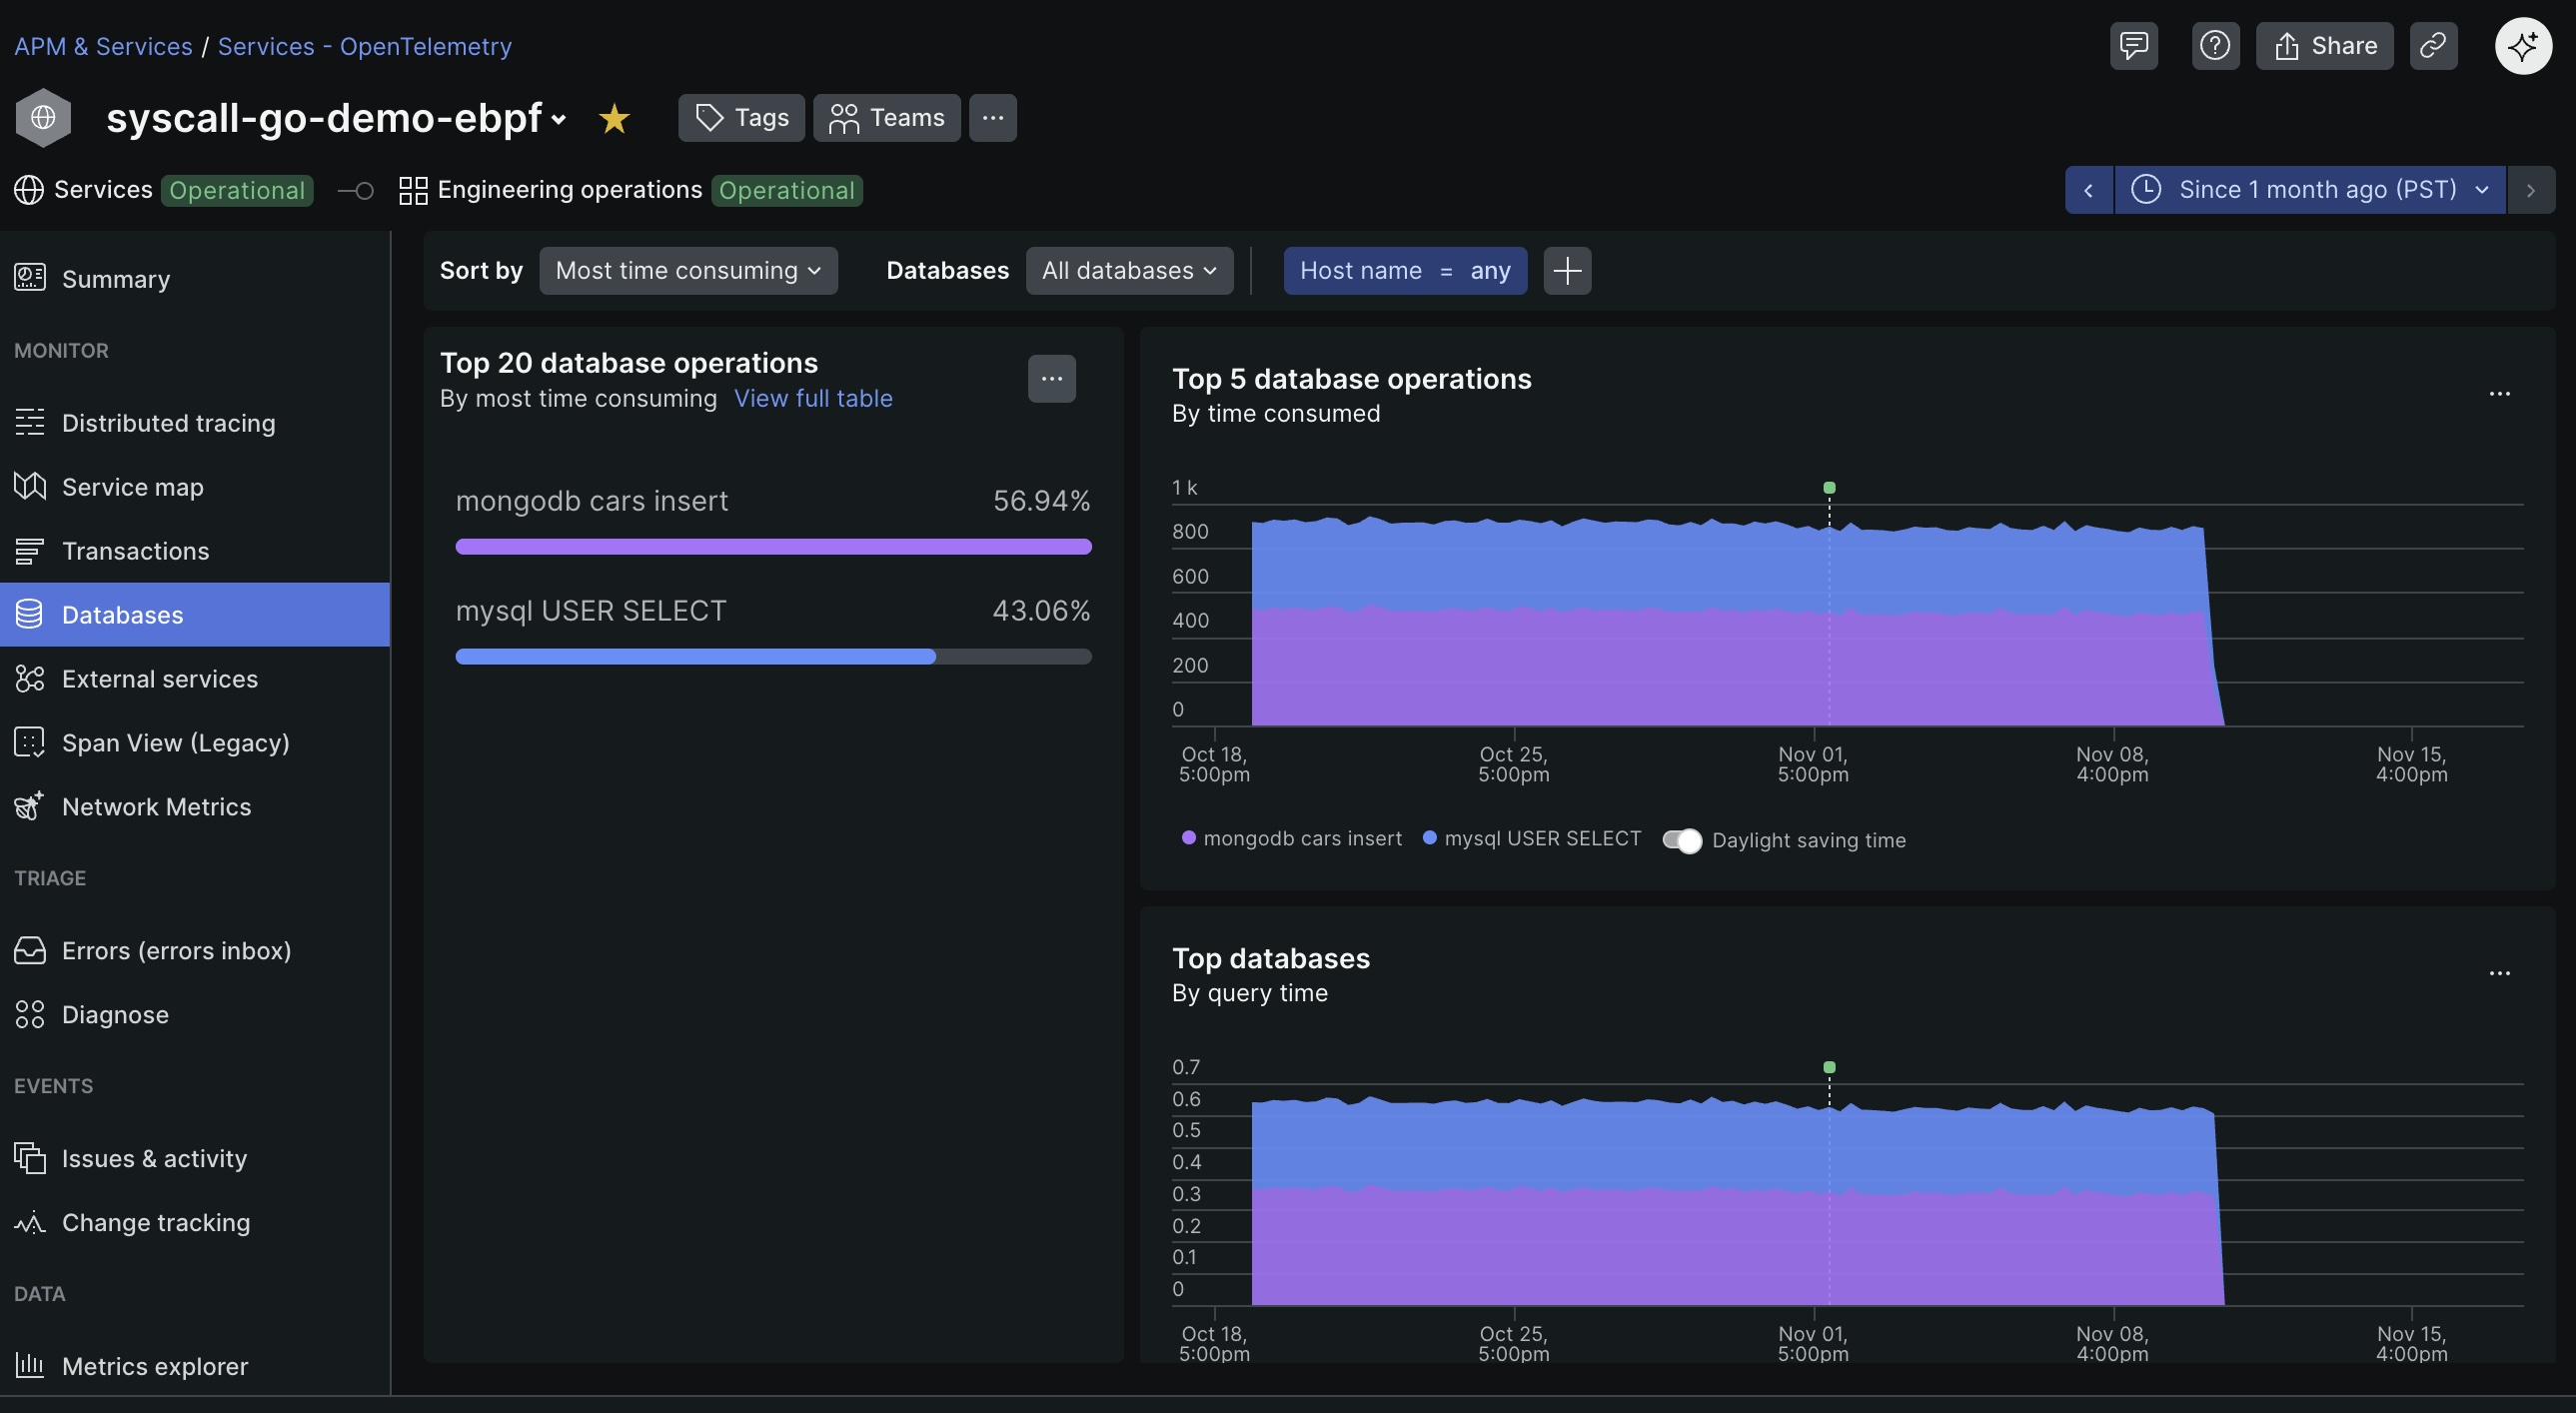
The first challenge is the traditional observability gap. Traditional APM tools lack kernel-level network and system metrics. This means that during an incident, it is difficult to pinpoint the root cause between application code issues and network-related issues.
Secondly, in microservices environments, customers often deploy heterogeneous agents. This creates operational overhead, potential agent conflicts, and requires application modification and restarts—significant pain points for DevOps teams.
The third problem is siloed data. After data is collected, correlating application logs with network spans and infrastructure metrics is manual and time-consuming, leading to incomplete observability.
With eAPM and eBPF network metrics, we aim to solve these problems by unification and simplification by pushing observability into the kernel. By operating at the kernel level, our single agent can simultaneously collect observability data including application span, logs, network traffic, and infra metrics. This natively eliminates the data silo problem. In addition, this approach simplifies rollout in microservices-heavy environments because we can now instrument the system without modifying applications.
What's New in eAPM (GA)
- Architecture support: Full support for both x86 and ARM64 architectures.
- Kubernetes and host support: Comprehensive Linux host support in addition to Kubernetes.
- Simplified onboarding: Get started quickly with the dedicated Integration Tile for ease of installation.
- Single-agent deployment: Only one agent is required per host or node.
- Continuous service discovery: Automatically maps your application services and lights up your APM UI.
- Segmented linking: Transactions now support multiple segments for deeper APM visibility.

Introducing eBPF Network Metrics (Public Preview)
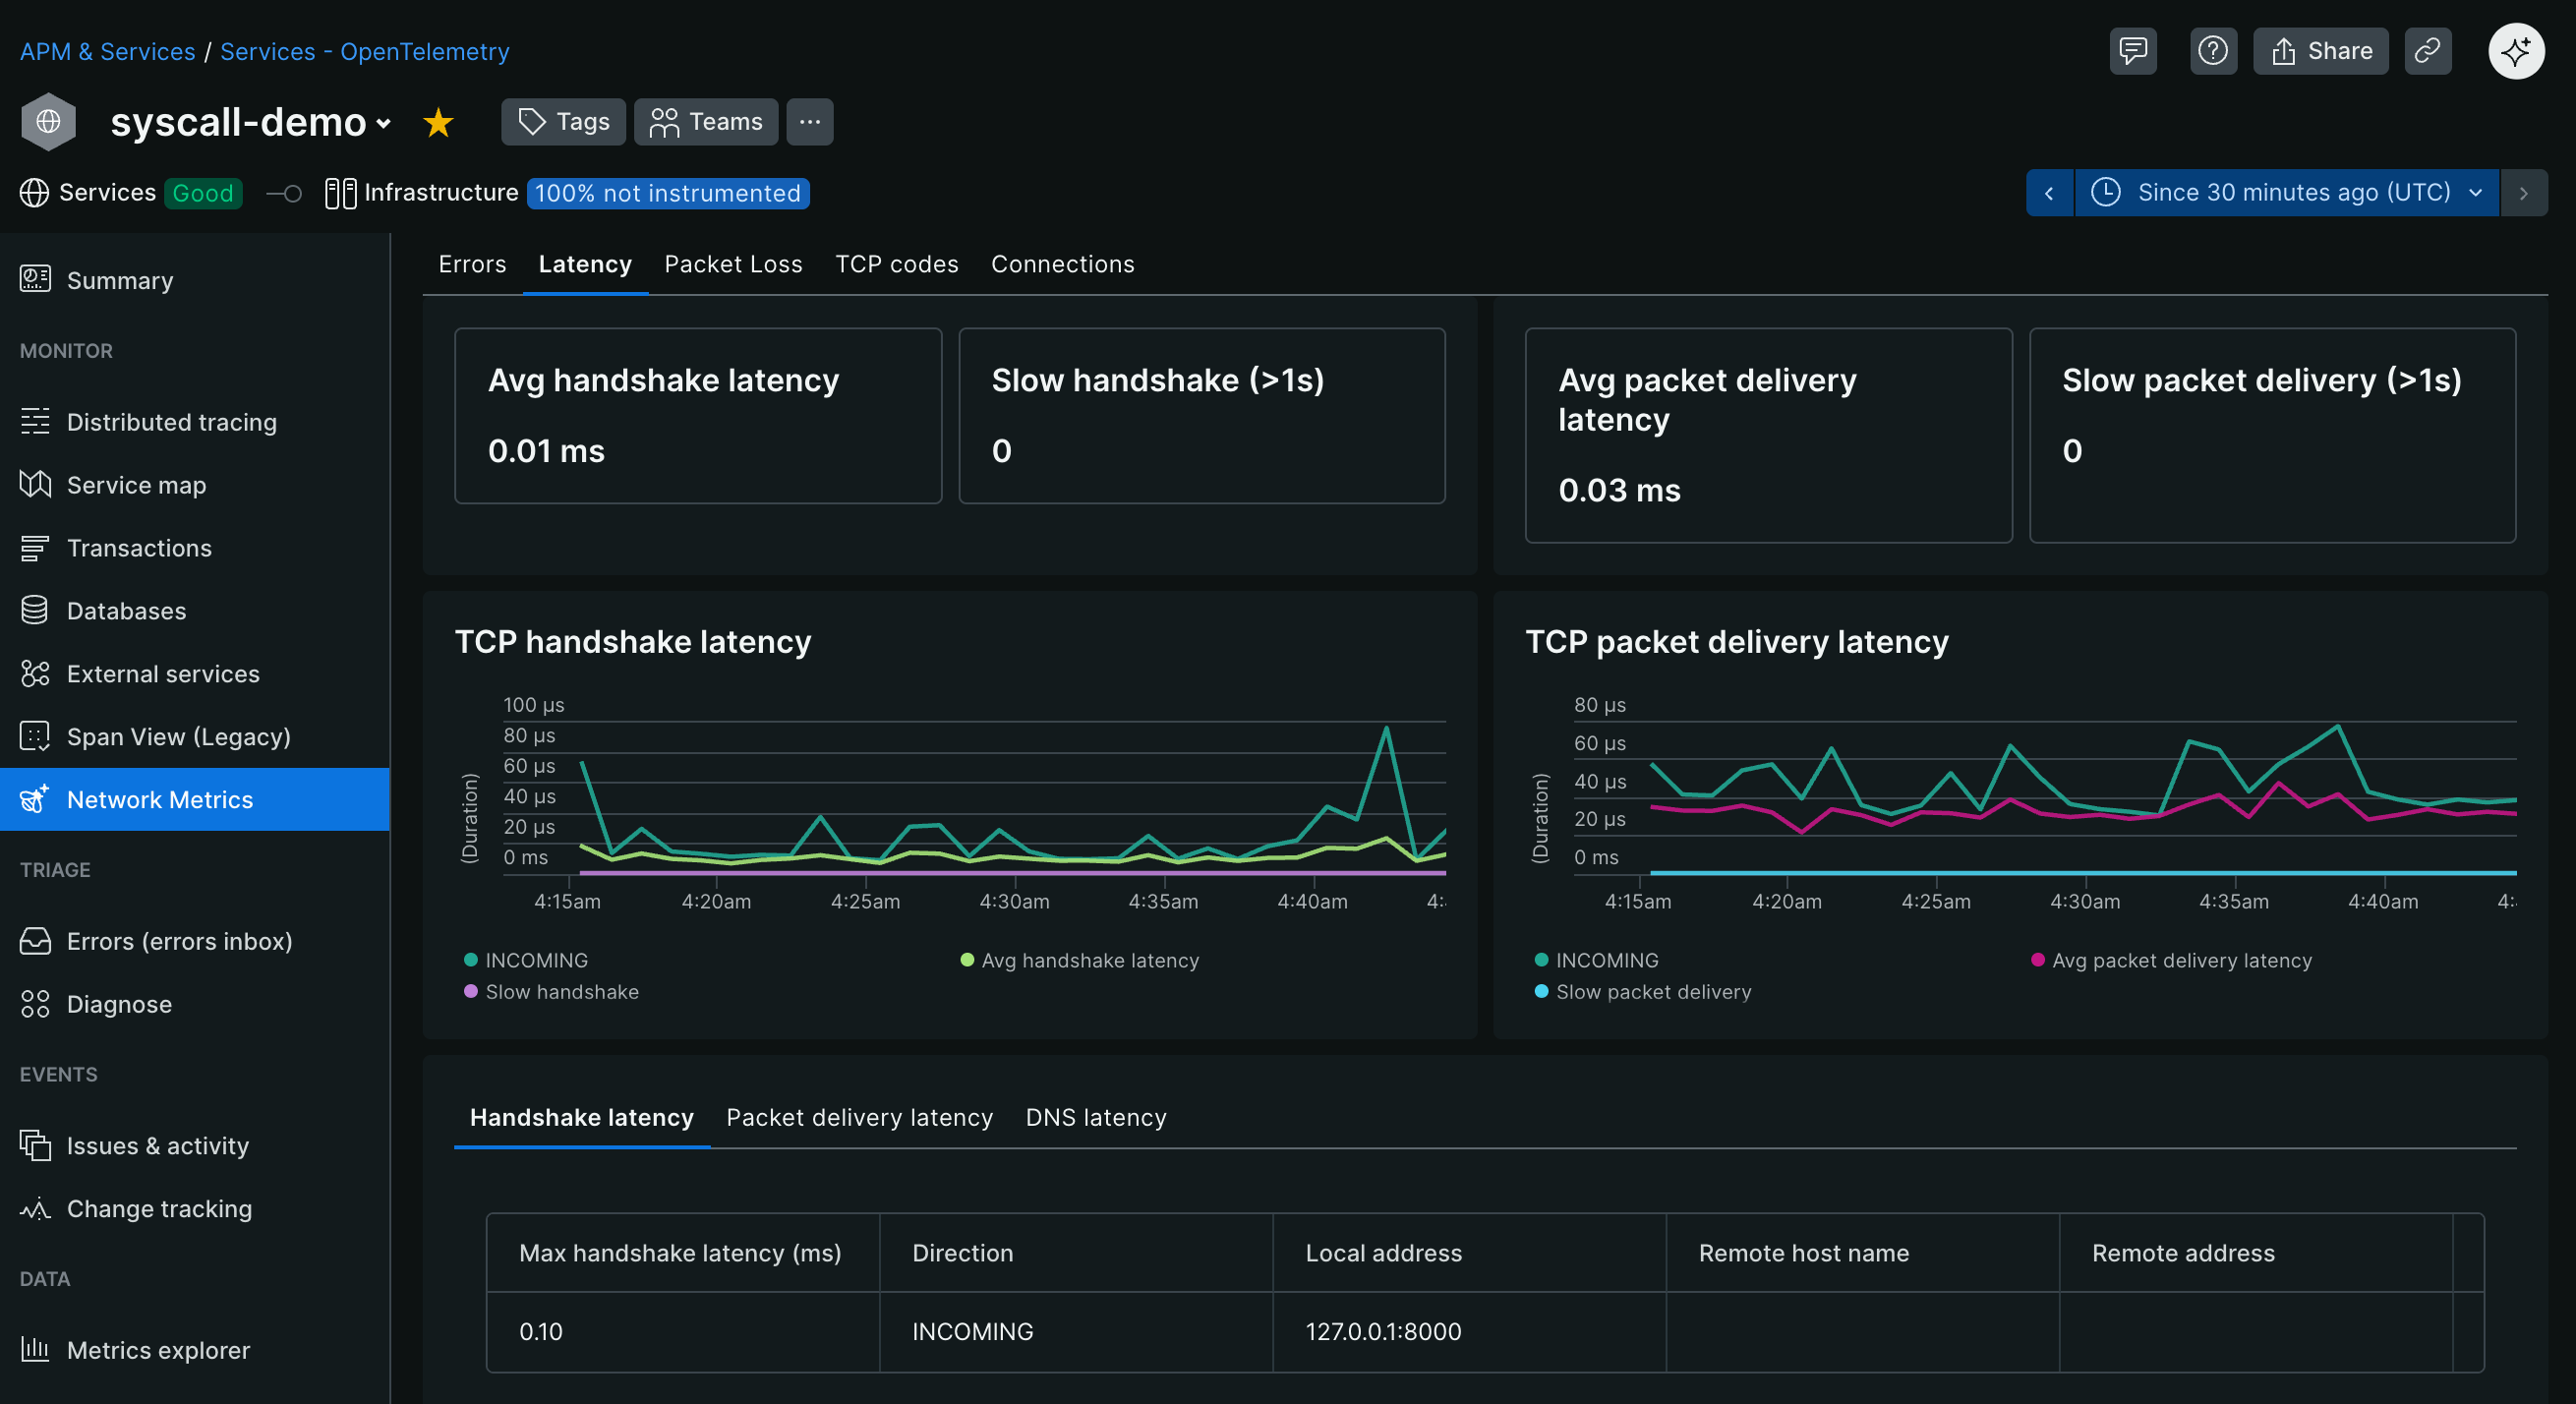
Deep Dive into application communication with rich network behavior insights. This capability delivers granular TCP and DNS telemetry (for example, handshake latency, retransmissions, DNS failures, and many more) captured directly from the Linux kernel.
When correlated with your application telemetry, this unified view helps engineers pinpoint root causes faster, improve reliability, and eliminate the cost and complexity of multiple monitoring tools.
This capability is complementary to APM. It works independently of your APM instrumentation method, providing a complete picture of your application's network communication health.
