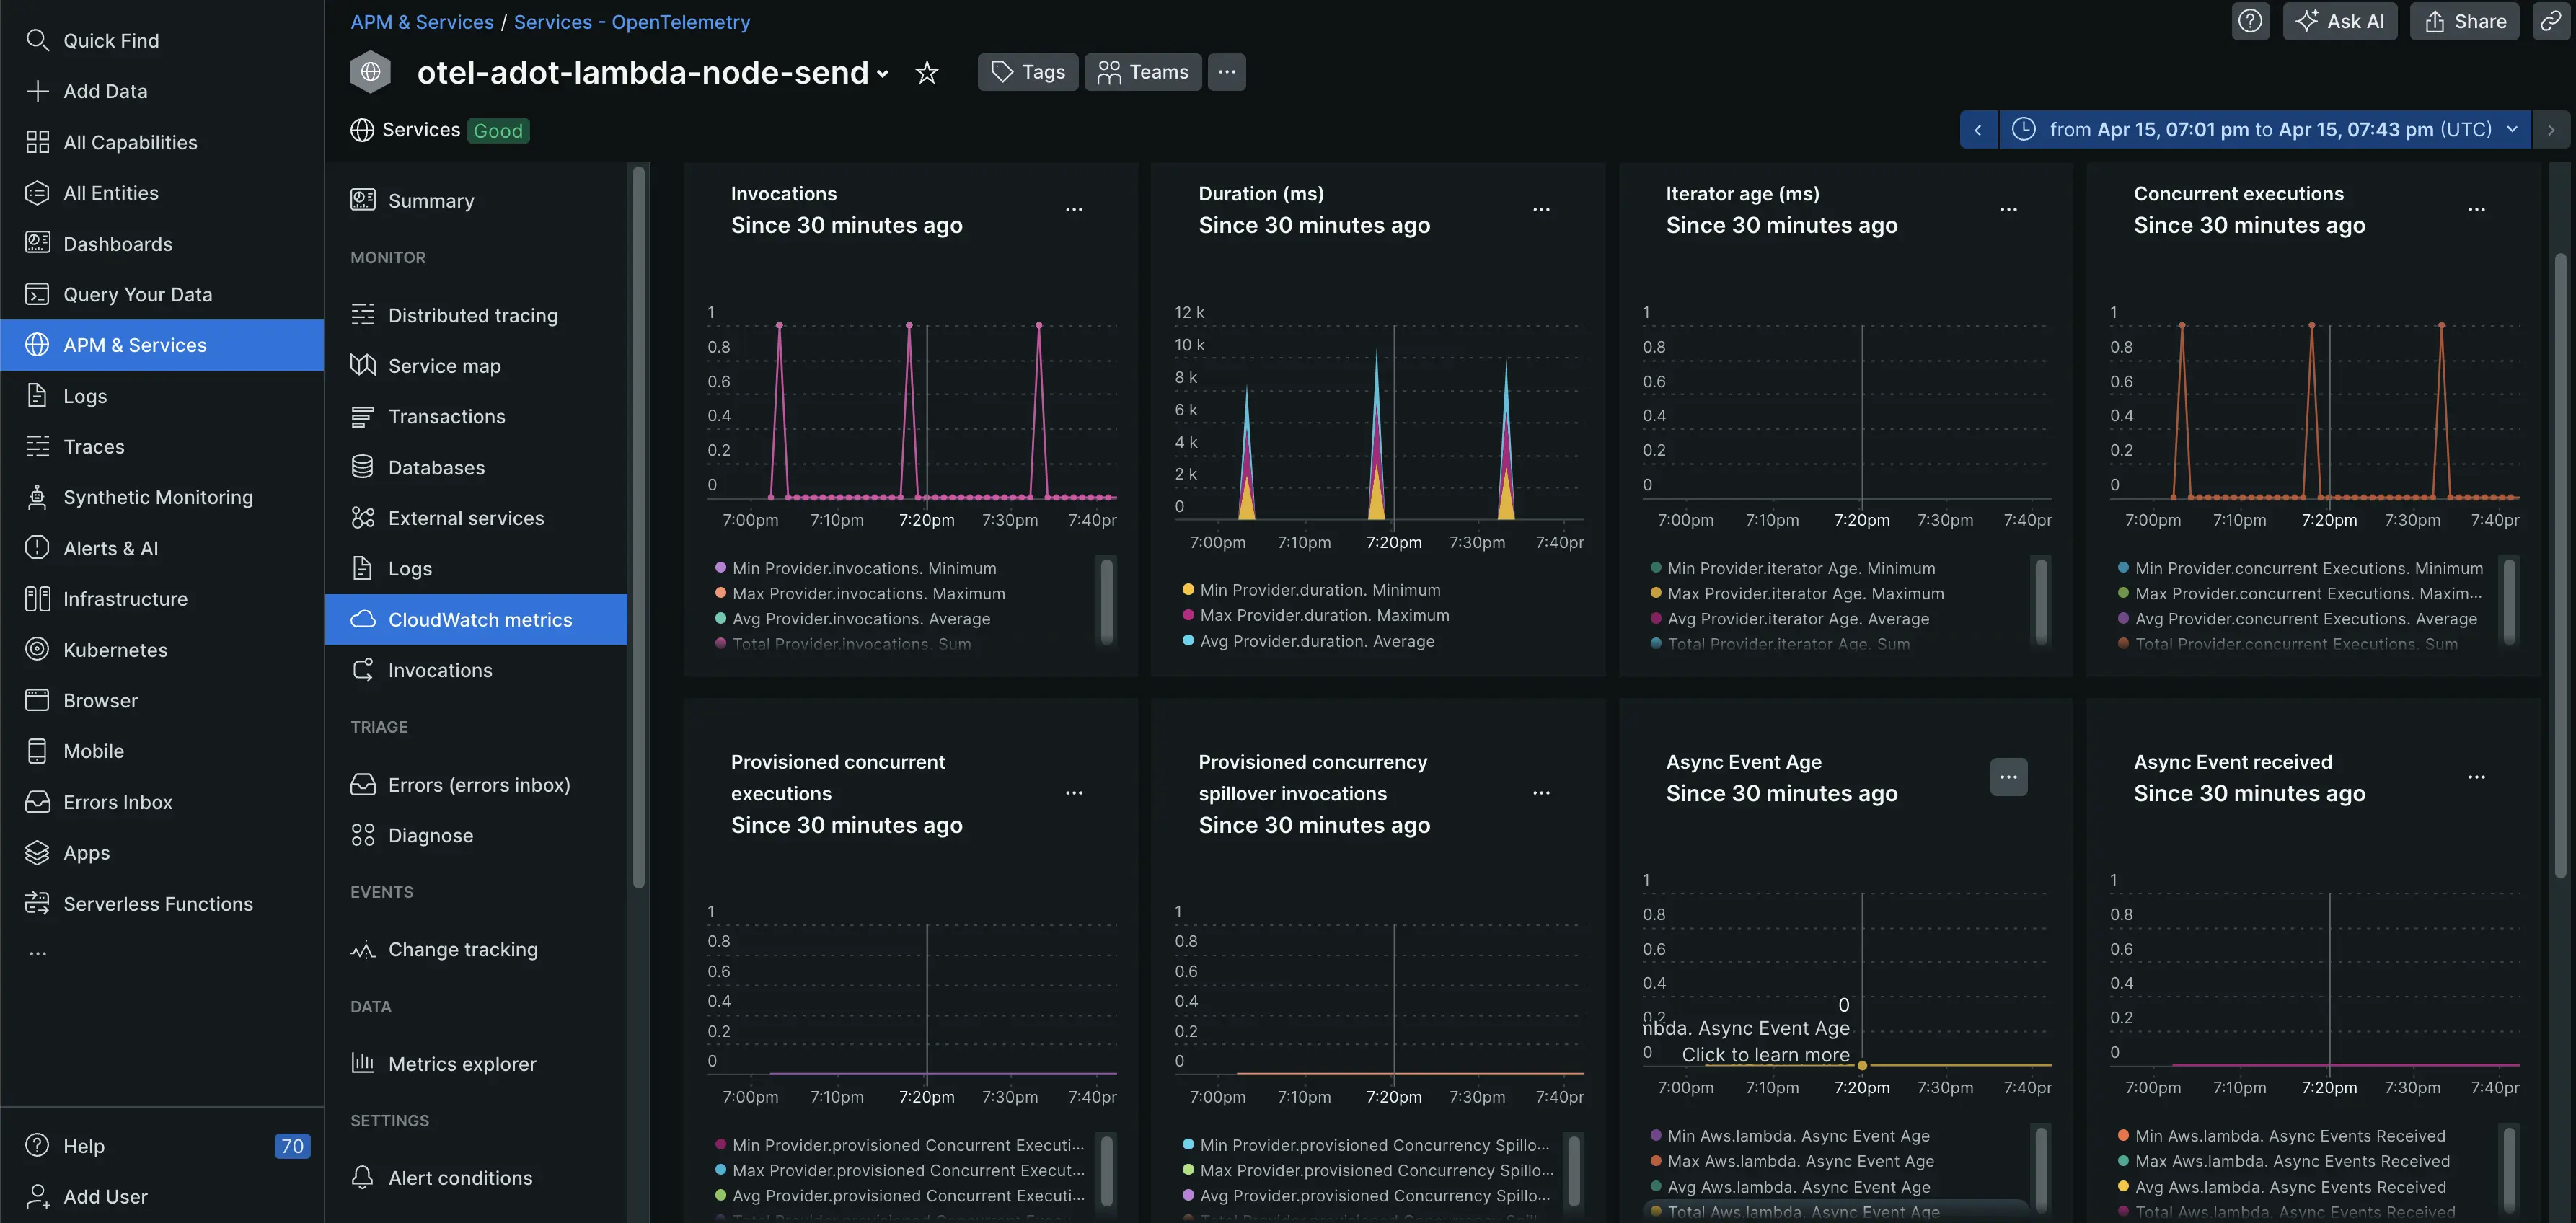
We're excited to announce deeper integration between OpenTelemetry and Lambda functions! This update brings the granular insights of invocations and CloudWatch metrics directly into your Lambda entity instrumented with OpenTelemetry, empowering you to easily monitor and analyze your serverless functions.
Lambda Invocations Gain a complete picture of each execution, including duration and the triggering event source (API Gateway, DynamoDB, etc.) to analyze your Lambda functions' performance.
CloudWatch Metrics Integration CloudWatch metrics are now integrated with OpenTelemetry to provide valuable insights into the health of your Lambda functions. Monitor critical metrics like invocation frequency, execution duration, errors, throttling events, concurrent executions, and even dead letter queue failures (if configured).
By monitoring this comprehensive data set, you can:
- Optimize Function Efficiency: Identify areas for improvement and streamline your Lambda functions for peak performance.
- Troubleshoot Issues Quickly: Pinpoint and resolve problems as soon as they arise, minimizing downtime and ensuring smooth operation.
- Proactive Monitoring with CloudWatch Alarms: Define custom thresholds and configure CloudWatch alarms to receive notifications when critical metrics exceed pre-defined limits, allowing you to proactively manage your serverless applications.
