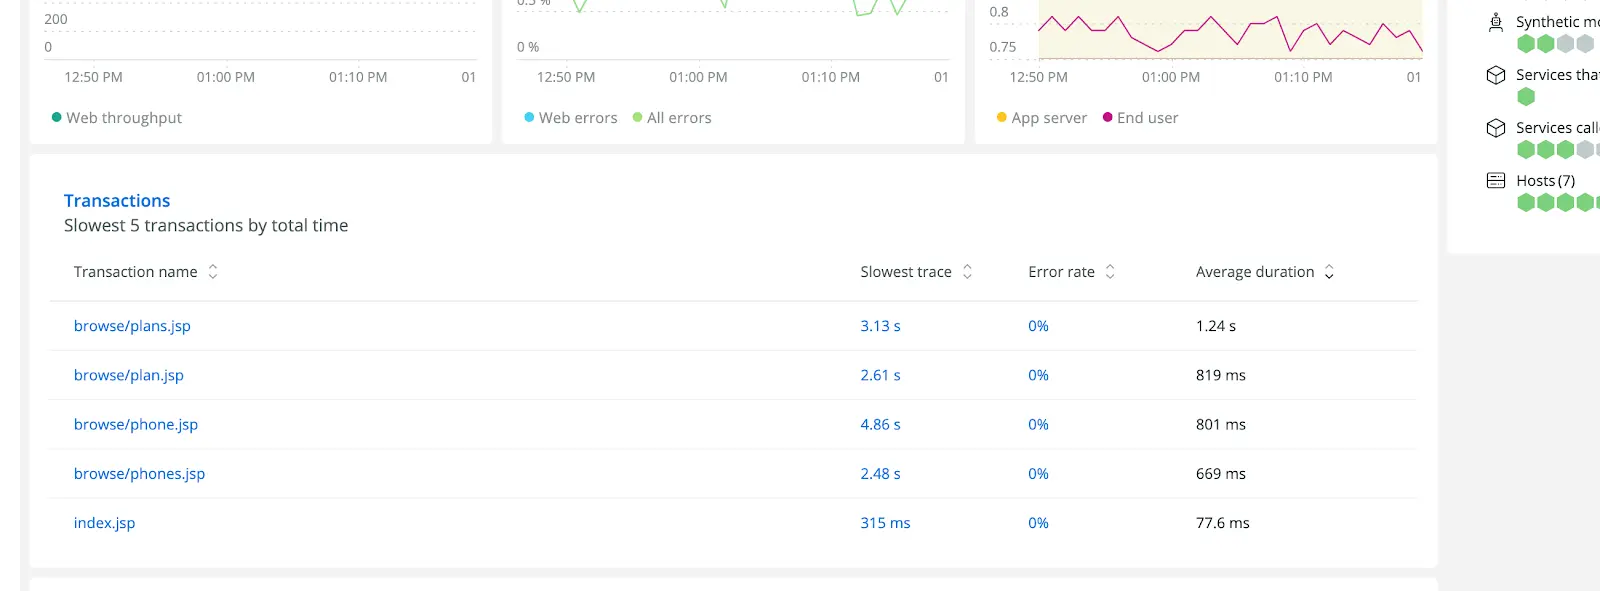
With the slow transactions list, you can jump to a complete slow trace of one of your top five most time-consuming transactions with one click from the Summary page. You can also, for the first time, see the error rates for those transactions, to instantly identify which code path is responsible for an increase in errors.

“Most time-consuming” means the transactions that your service is spending the most total time processing, expressed as throughput multiplied by average response time.
As with other charts on the Summary, you can filter the slow transactions list to different types of transactions (web, non-web, and so on), or to transactions served by a particular instance of your service, using the filter controls at the top of the page.
The slow transactions list is available today for services instrumented with the New Relic agent.