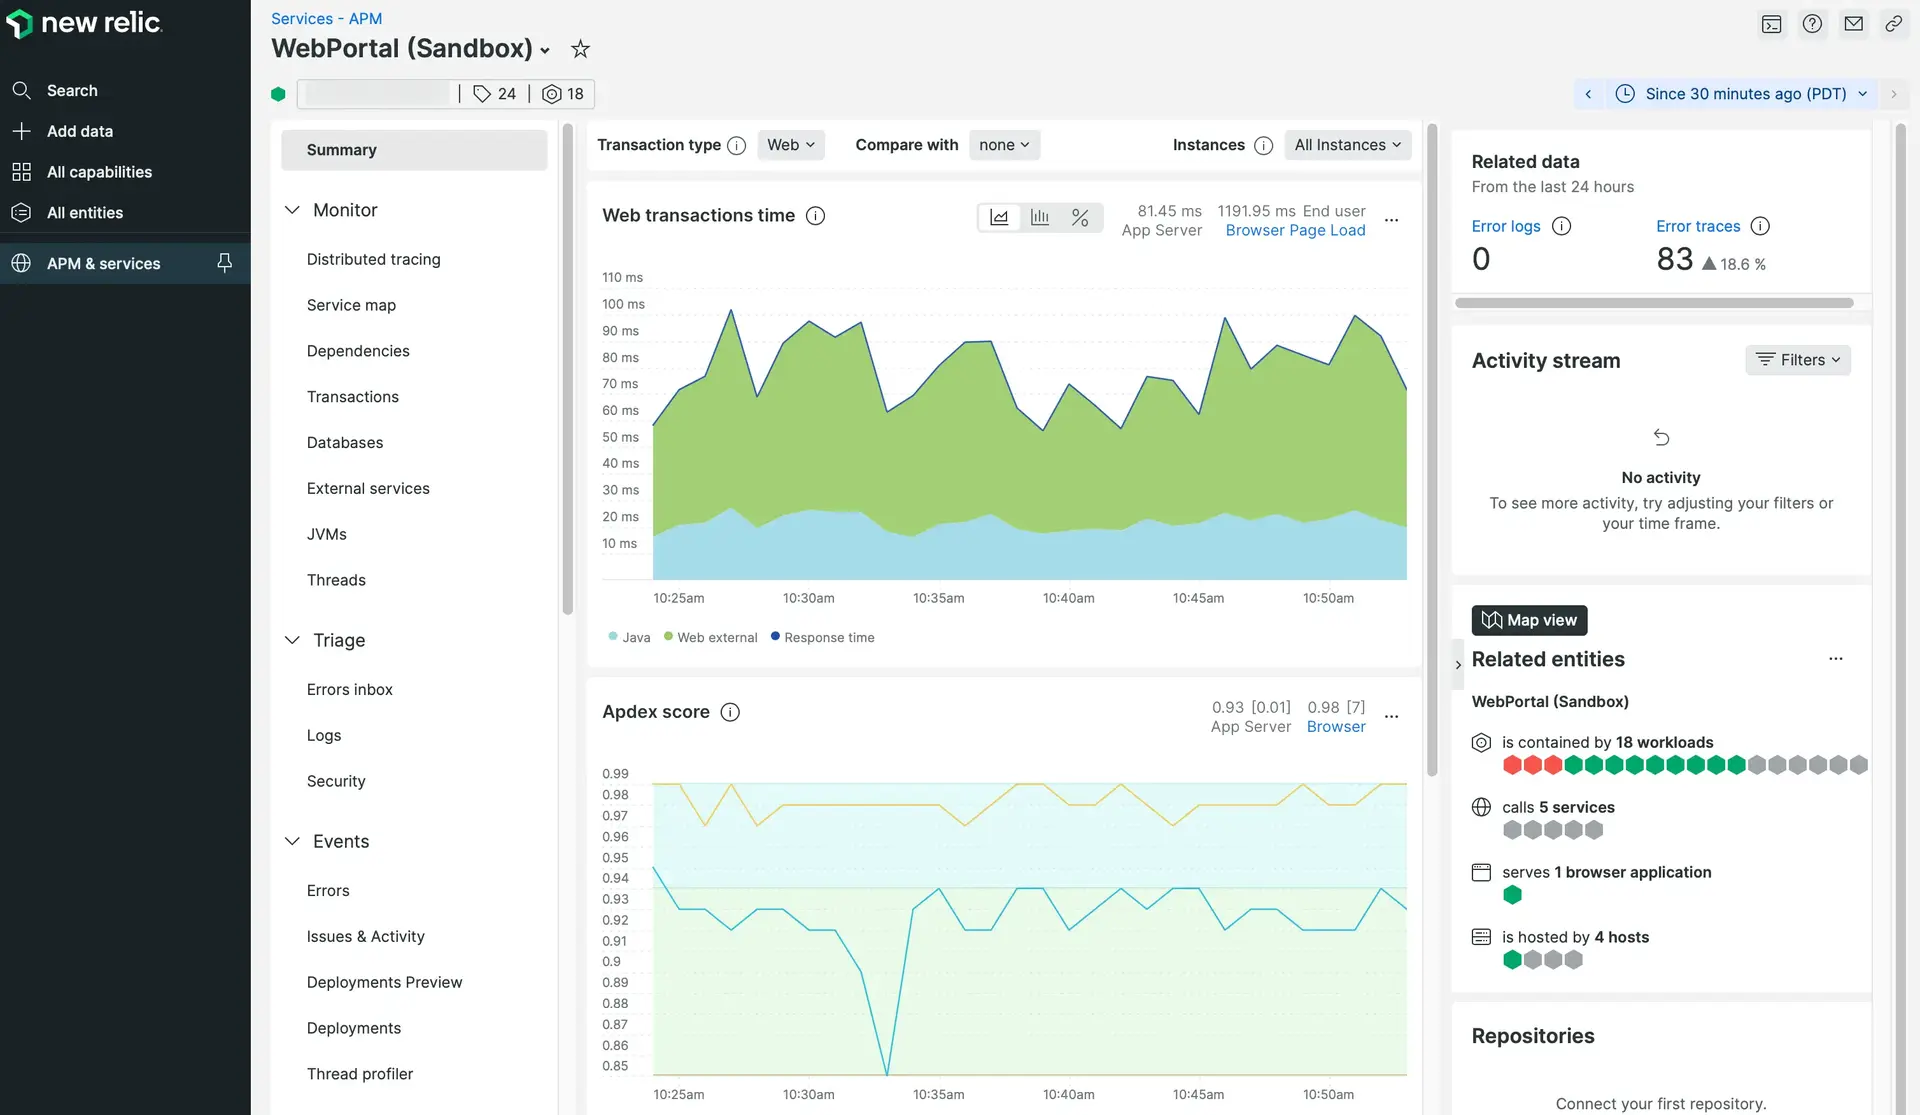
Monitor your Java app
New Relic supports the most popular Java app servers, frameworks, virtual machines, and tools. Once installed, the APM agent monitors your app's performance and gives you insight into that performance. You can use this doc to get started manually, or you can install the Java agent through the New Relic UI.

To get the most out of this page, select your app deployment and framework. You need a New Relic account to finish the installation process. Want more context? See our intro to APM, or learn how to solve your app's performance issues with our My app is slow tutorial.
Sugerencia
Is your application running on a Kubernetes cluster? Try out our installation method using the Kubernetes APM auto-attach.
¿Te ha ayudado este documento con la instalación?
What's next?
Now that you've installed the Java agent, learn how to solve performance issues with our tutorial series.
See your app data in the UI.
Look for your app name on the APM Summary page (it can take a few minutes).
Read the documentation about APM.
For example, read about the Summary page, the JVM metrics page, and the Transactions page.