---
title: Create performance benchmarks with service levels
source: https://docs.newrelic.com/docs/tutorial-improve-app-performance/create-benchmarks
---
## Objectives [#objectives]
By the end of this tutorial, you will:
- Understand service level indicators (SLIs) and service level obectives (SLOs).
- Have created and defined SLIs and SLOs for your front-end experience.
- Have alerts set up to warn of any SLI or SLO breaches so you can react before they impact your users.
## Why create performance benchmarks [#why]
Now that you've remdiated the root cause of your app's performance issues, let's set up service levels so you can respond quickly if any slowness appears again.
Let's look at the difference between service levels, SLOs and SLIs.
\_Service levels describe services provided to users within a given period of time, in measurable terms.
\_Service level objectives (SLOs) are the goals set for the availability expected out of a system.
\*Service level indicators (SLIs) are the key measurements and metrics to determine the availability of a system.
Tying all these together allows you to:
- Ease future setup now that you've establish a baseline of performance and reliability for your app.
- Define reliability across teams with SLO and SLI recommendations that help you determine service boundaries.
- Standardize reliability: Cross-organizational teams have a unified, transparent view of service reliability, and can better comply with customer-facing SLAs.
## Create performance benchmarks [#create]
Let's get started with creating your application performance benchmarks:
1. While there are a large amount of SLIs you could use to define your performance benchmarks, the following are some we specifically reccomend. Each collapser has an explanation of when you should choose that SLI and a corresponding NRQL query (which you'll use in step 2).
For now, just select one of the following:
**SLIs for APM services instrumented with the New Relic agent**:
Based on `Transaction` events, these SLIs are the most common for request-driven services:
**Service success**
Service success is the ratio of the number of successful responses to the number of all requests. Effectively, this is an error rate, but you can filter it down, for example removing expected errors.
**Valid events fields**
````sql
FROM: Transaction
WHERE: entityGuid = '{entityGuid}'
```
Where `{entityGuid}` is the service's GUID.
**Bad events fields**
```sql
FROM: TransactionError
WHERE: entityGuid = '{entityGuid}' AND error.expected IS FALSE
```
Where `{entityGuid}` is the service's GUID.
````
**Service latency**
A latency SLI measures the proportion of valid requests that were served faster than the threshold established as a good experience.
In order to determine that duration threshold, check how the service has been performing in the past weeks, and use that result as a realistic and achievable baseline. Afterwards, you can iterate on the SLI threshold, and align it with a more ambitious performance.
To select an appropriate value for the duration condition, one typical practice is to select the 95 percentile duration of the responses for the last 7 or 15 days. Find this duration threshold using the [query builder](https://docs.newrelic.com/docs/query-your-data/explore-query-data/query-builder/introduction-query-builder/), and use it to determine good events for your SLI:
````sql
SELECT percentile(duration, 95) FROM Transaction WHERE entityGuid = '{entityGuid}' SINCE 7 days ago LIMIT MAX
```
**Valid events fields**
```sql
FROM: Transaction
WHERE: entityGuid = '{entityGuid}' AND transactionType = 'Web'
```
Where `{entityGuid}` is the service's GUID.
**Good events fields**
```sql
FROM: Transaction
WHERE: entityGuid = '{entityGuid}' AND transactionType = 'Web' AND duration < {duration}
```
* Where `{entityGuid}` is the service's GUID.
* Where `{duration}` is the response time that you consider provides a good experience for your client service or end-user, in seconds.
````
> #### 💡 TIP
>
> Your organization should define SLOs and SLIs based on your specific needs, your user's expectations, and resources available. After completing this tutorial, we recommend you [learn more about how to define granular custom service levels](https://docs.newrelic.com/docs/service-level-management/create-slm/#define-user-exp).
2. 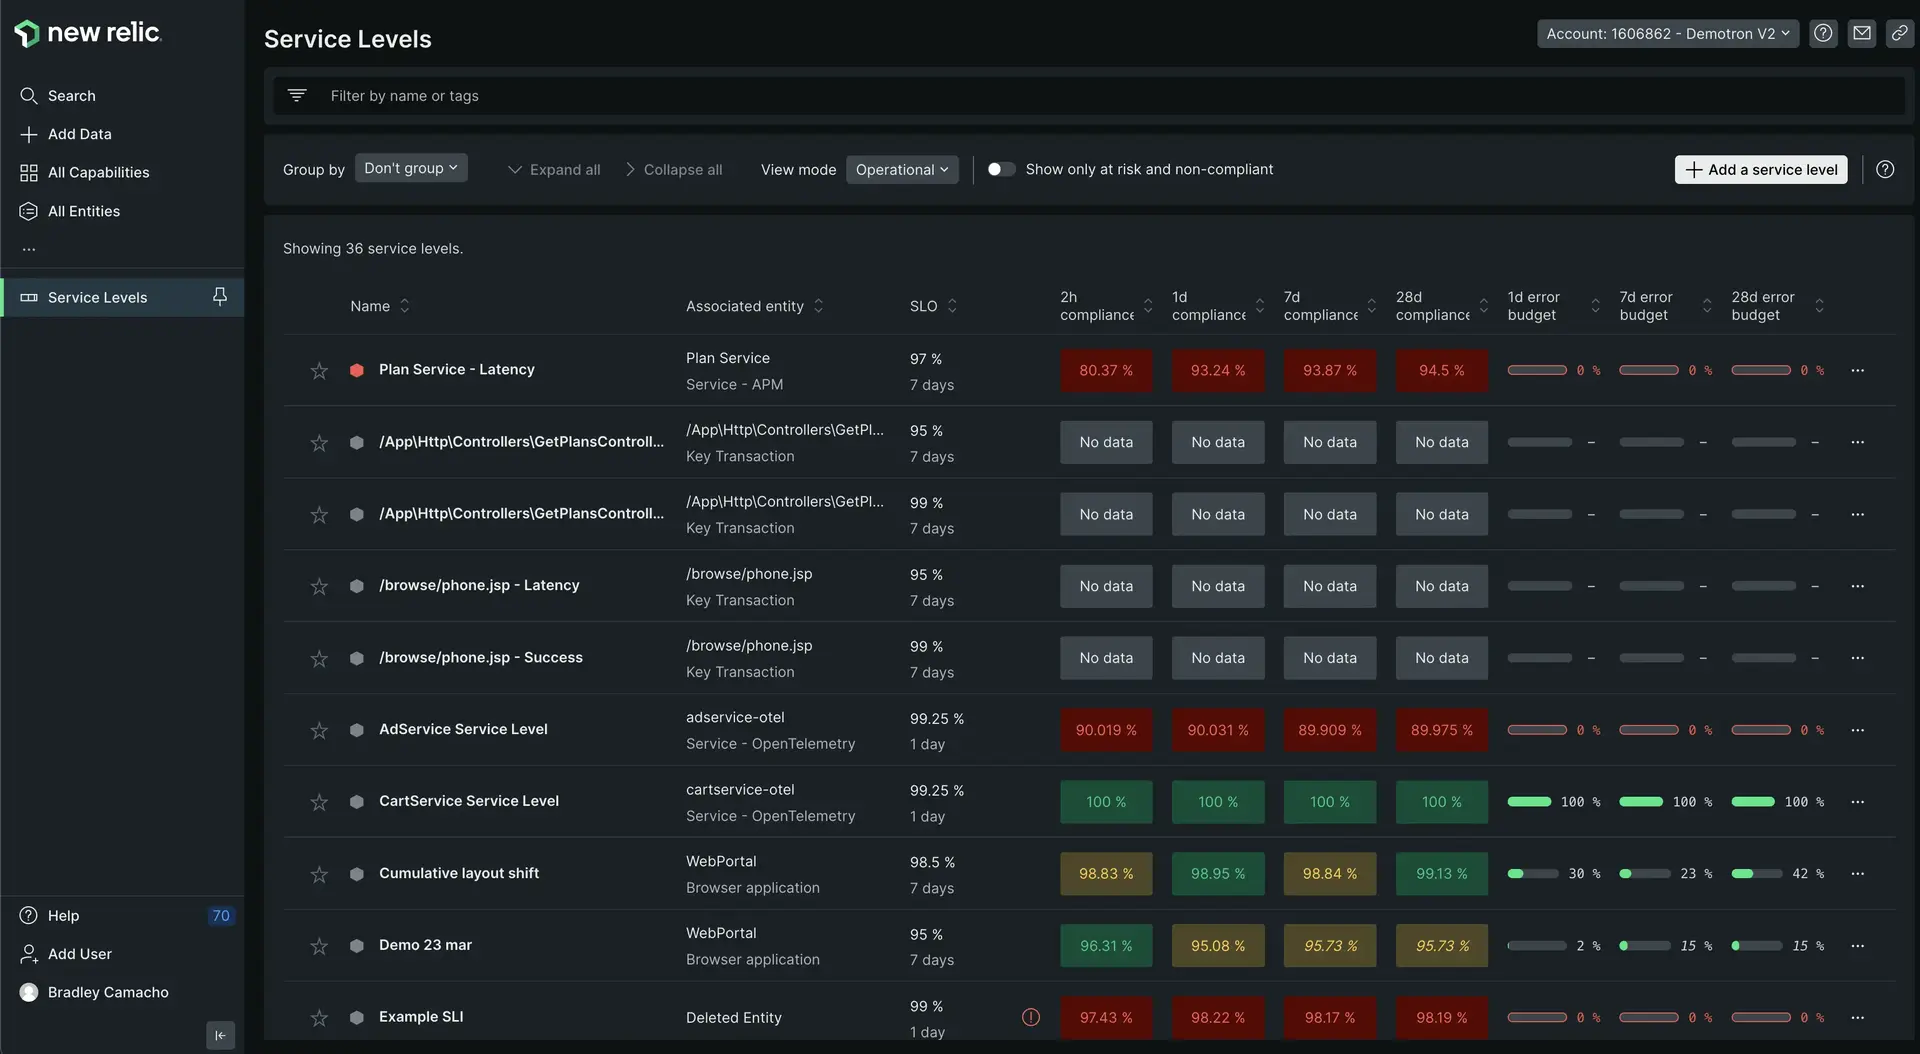
1. Navigate to **[one.newrelic.com](https://one.newrelic.com) > All capabilities > Service levels management**. This UI shows all your service levels and allows you to define, monitor, and edit them.
2. Select **+ Add a service level** in the top right of the UI.
3. Choose the corresponding entity that you want to create a service level for. This could be an entire workload, a specific service, a synthetic monitor, or even a specific transaction. Once you've selected your entity, click **Continue** on the left side of the UI pane.
4. Define the SLI you chose in step one in this pane. For example if you chose to define an SLI for service success, you would use the following queries:
**Valid events fields**
````sql
FROM: Transaction
WHERE: entityGuid = '{entityGuid}'
```
Where `{entityGuid}` is the service's GUID.
**Bad events fields**
```sql
FROM: TransactionError
WHERE: entityGuid = '{entityGuid}' AND error.expected IS false
```
Where `{entityGuid}` is the service's GUID.
Select **Continue** in the left pane once you've confirmed your queries are correct to complete the creation of your service levels.
````
## Next steps [#next-steps]
Congratulations! You've completed our journey on how to use New Relic to improve your app's performance! Ready to learn more about New Relic features? Take a deeper dive:
- [Introduction to service maps](https://docs.newrelic.com/docs/new-relic-solutions/new-relic-one/ui-data/service-maps/introduction-service-maps/)
- [Introduction to APM](/introduction-apm/)
- [APM best practices](https://docs.newrelic.com/docs/new-relic-solutions/best-practices-guides/full-stack-observability/apm-best-practices-guide/)
- [Intro to service level management](https://docs.newrelic.com/docs/service-level-management/intro-slm/)
[Prepare to triage your application](https://docs.newrelic.com/docs/journey-app-slow/root-causes)
[Identify problematic transactions](https://docs.newrelic.com/docs/journey-app-slow/problematic-transactions)
[Identify slow database queries](https://docs.newrelic.com/docs/journey-app-slow/slow-database-queries)
[Identify slow external services](https://docs.newrelic.com/docs/journey-app-slow/external-services)
[Create performance benchmarks](https://docs.newrelic.com/docs/journey-app-slow/create-benchmarks/)