---
title: Advance your dashboarding with NRQL
source: https://docs.newrelic.com/docs/nrql/nrql-tutorials/nrql-tutorial-advanced-dashboarding
---
Seeing example queries and explanations in the context of your own data can help you transform data with more advanced concepts like rate of change and aggregation. In this tutorial, you'll build on the concepts found in [foundations of using NRQL](https://docs.newrelic.com/docs/query-your-data/nrql-new-relic-query-language/get-started/introduction-nrql-tutorial/) and [controlling your data with NRQL](https://docs.newrelic.com/docs/query-your-data/nrql-new-relic-query-language/get-started/nrql-tutorial-process-your-data/) with more advanced concepts.
You'll learn how to advance your dashboarding by using faceting by case, advanced aggregation functions, the `EXTRAPOLATE` keyword, filtering aggregation functions, and overriding values. Specifically, you'll learn how to use the following:
- Advanced aggregation functions like `filter()`, `apdex()`, `rate()`, `funnel()`, and `histogram()`.
- The `EXTRAPOLATE` clause.
- `FACET CASES()` for attribute and group matching values.
- `filter()` for combining event types.
- Value overrides.
You may not use these functions and features on every single dashboard, but they prove useful when tackling specific problems and requirements.
## Use advanced aggregators
### Calculate rate
Let's start with the `rate()` function. It allows you to visualize the frequency of events over time, which helps identify patterns within shorter periods of a larger time window.
In the example below, you can see the average frequency of requests every 5 minutes for the last hour compared to the previous hour's 5-minute average frequency. Notice the query uses `SINCE 1 hour ago`. This is the overall time window in which you're calculating the rate.
````sql
SELECT rate(count(*), 5 minutes)
FROM Public_APICall
SINCE 1 hour ago
COMPARE WITH 1 hour ago
```
````
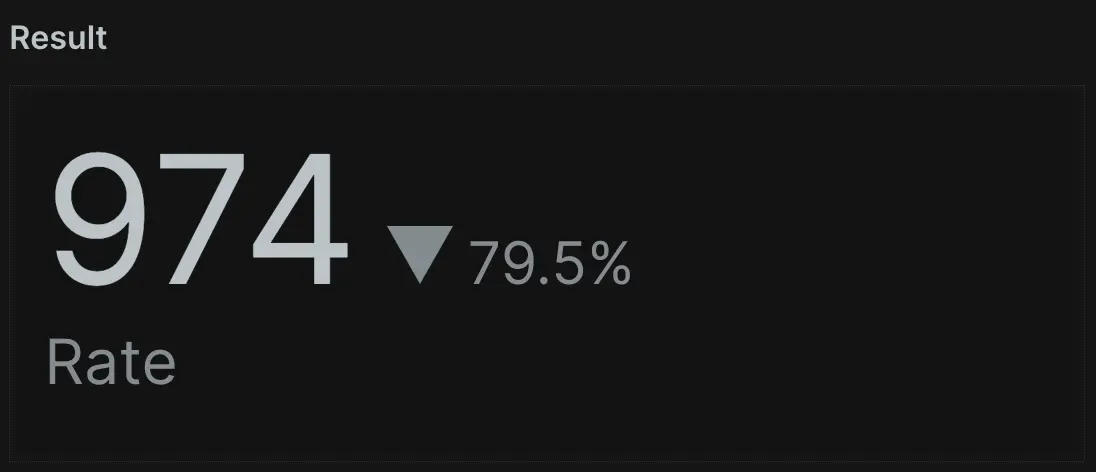
You can use `rate()` to calculate requests per minute or requests per second by setting the time interval to either 1 minute or 1 second.
### Understand end user behavior with funnel charts
Funnel charts track the occurrence of an attribute value across multiple records, and many people use them to understand end-user behavior. You might often use them to visualize how successfully users progress through defined paths, and especially when using custom attributes.
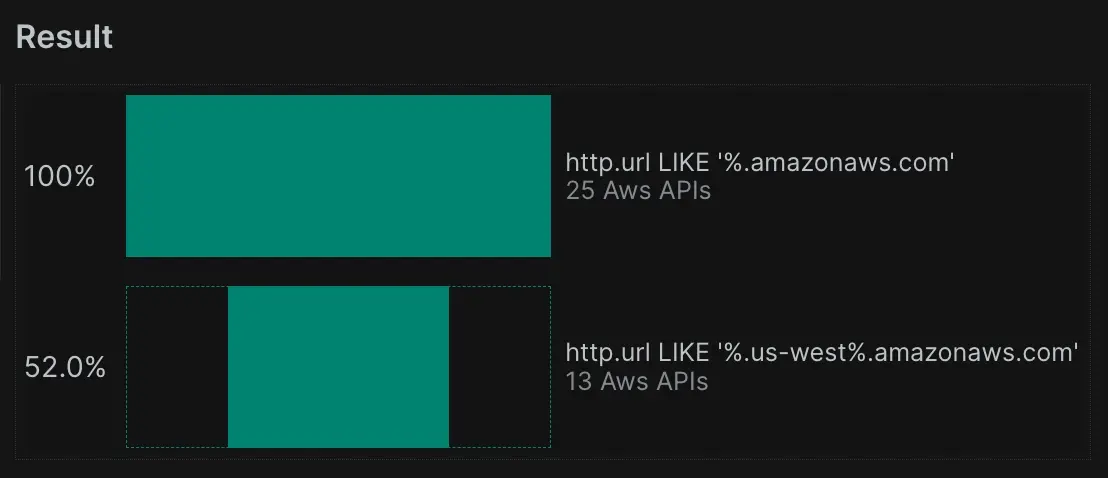
You can use the `funnel()` aggregator function to visualize how many users visit a specific page before moving on to another page. The first parameter is the identifying attribute for the unique entries you're counting. In this case, New Relic assigns and retains a `session ID` attribute for each user on your site (if the user has cookies enabled). You can also set your own session ID using custom attributes.
The remaining parameters determine how each step of the funnel is calculated, written in the format `, WHERE attr OP value`. In this case, you have two: one that shows how many user sessions visited the homepage, then another that shows how many of these also navigated to other pages. Try a query like this on your own data and see what you get!
````sql
SELECT funnel(awsAPI, WHERE http.url LIKE '%.amazonaws.com', WHERE http.url LIKE '%.us-west%.amazonaws.com')
FROM Public_APICall
SINCE 1 week ago
UNTIL now
```
````
### Aggregator filters
`filter()` is a versatile function that allows you to aggregate multiple data points in a single query, offering more control over which events the function result returns. In this example, you use `filter()` to return the separate values for total transactions, total web transactions, and total non-web transactions:
````sql
SELECT count(*) AS 'All Transactions', filter(count(*), WHERE awsAPI = 'dynamodb') AS 'DynamoDB', filter(count(*), WHERE awsAPI = 'sqs') AS 'SQS'
FROM Public_APICall SINCE 1 day ago
```
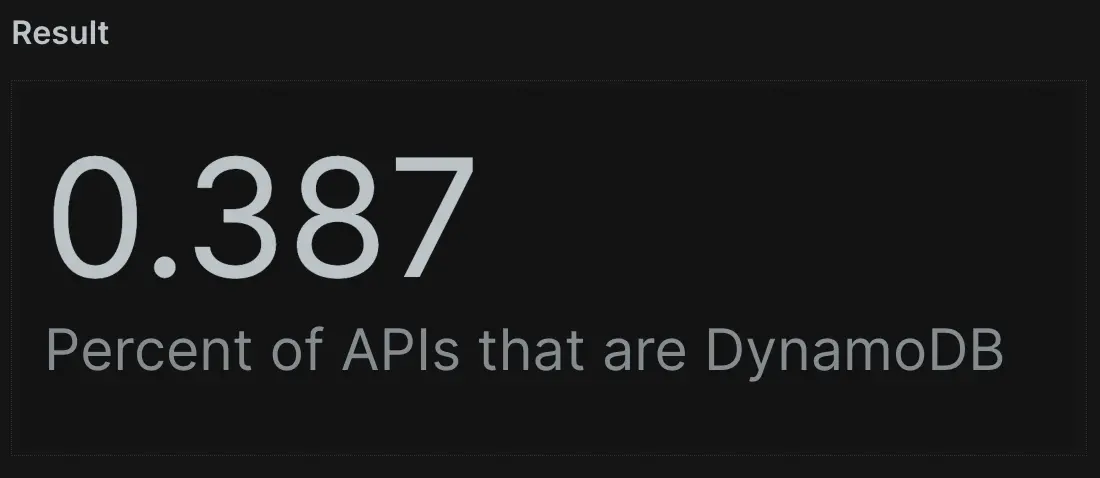
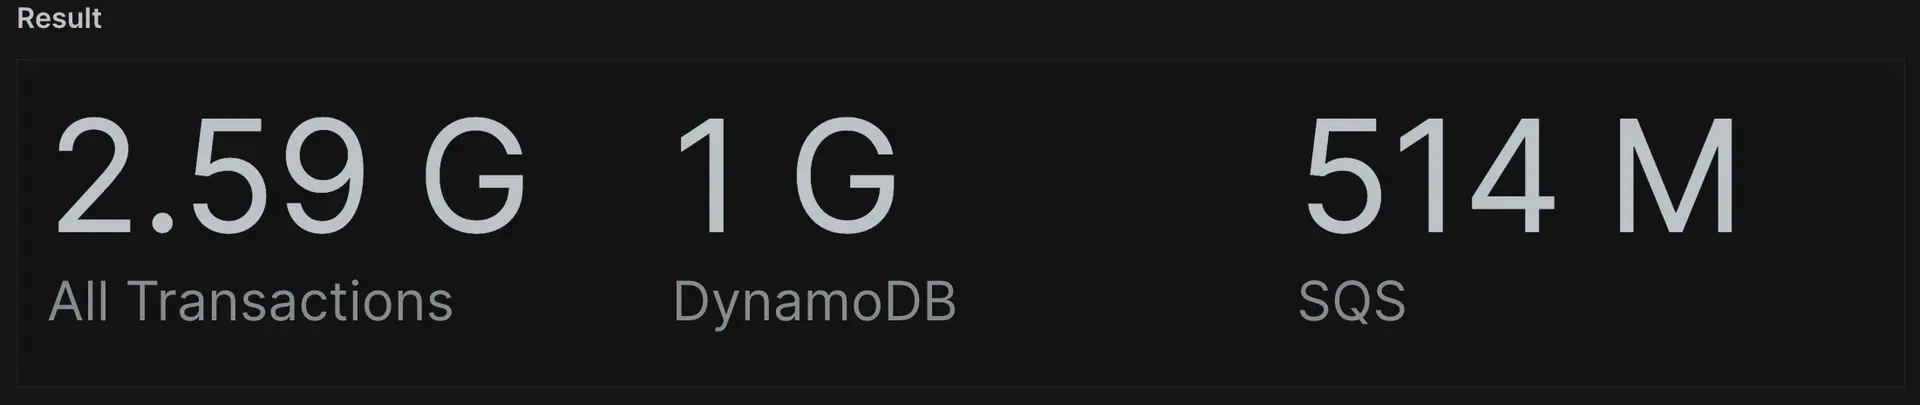 Since it returns a number, you can also perform math on the query's results. For example, you can divide total API calls by all API calls to see what percentage of them were DynamoDB:
```sql
SELECT filter(count(*), WHERE awsAPI = 'dynamodb') / count(*) AS 'Percent of APIs that are DynamoDB'
FROM Public_APICall
SINCE 1 day ago
```
Since it returns a number, you can also perform math on the query's results. For example, you can divide total API calls by all API calls to see what percentage of them were DynamoDB:
```sql
SELECT filter(count(*), WHERE awsAPI = 'dynamodb') / count(*) AS 'Percent of APIs that are DynamoDB'
FROM Public_APICall
SINCE 1 day ago
```
 ````
### Histograms
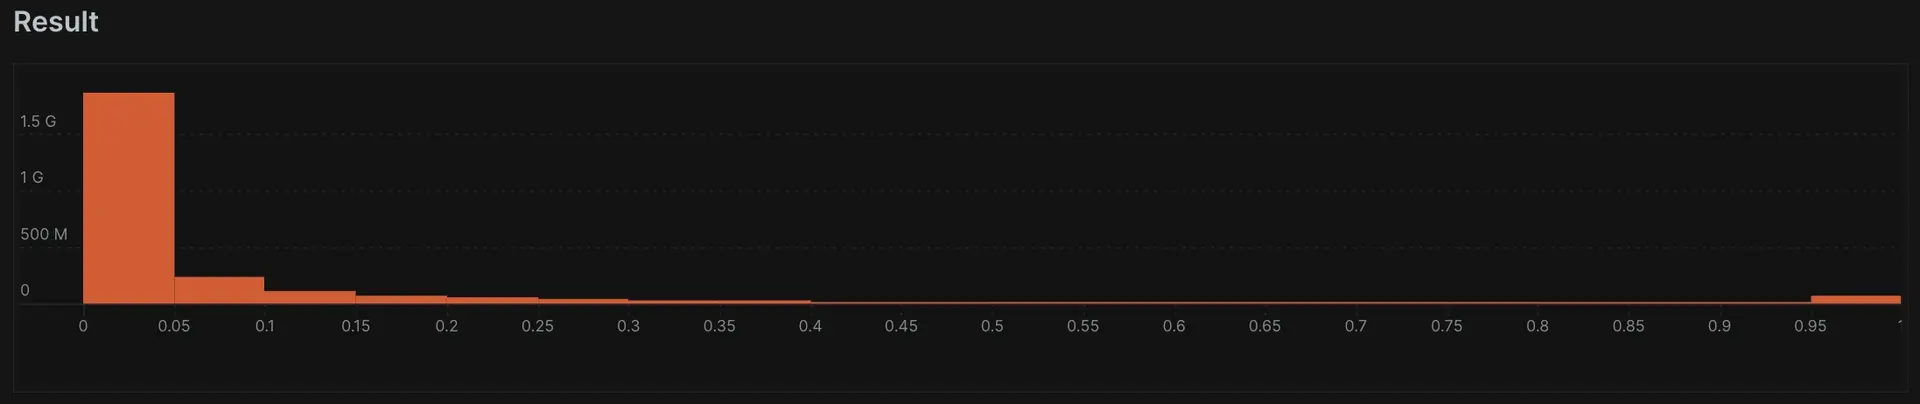
Histograms show the distribution of your data across frequency buckets rather than as a single average. This helps you understand data point grouping by frequency, not just averages. The `histogram()` function takes three arguments:
1. The attribute you want to plot (such as duration).
2. The maximum value of the range you want to consider (such as "1" for 1 second or less).
3. The number of buckets you want data grouped in.
In this example, you create a `histogram()` chart for all duration values between 0 and 1 second, grouping them into 50ms buckets. You do this by specifying "20" for the number of buckets. All the durations larger than 1 second group together in the last bucket.
````sql
SELECT histogram(duration, 1, 20)
FROM Public_APICall
SINCE 1 day ago
```
````
### Apdex
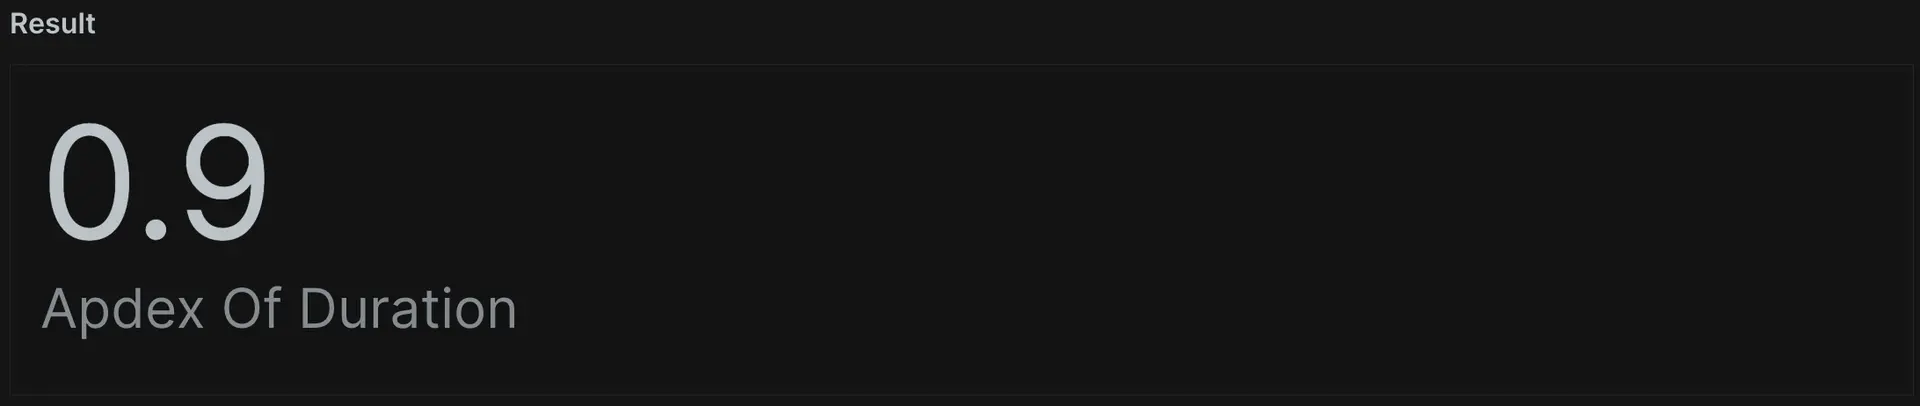
The `apdex()` function calculates an Apdex score on any numerical value (such as duration). You can calculate Apdex for one or more specific transactions to account for custom attribute values. You can even provide your own Apdex-T value without interfering with application settings. In this example, you provide the function with an attribute of "duration" and an Apdex-T value of 0.01, reporting it as "Apdex of Duration":
````sql
SELECT apdex(duration, 0.1) AS 'Apdex Of Duration'
FROM Public_APICall
SINCE 1 week ago
```
````
### Histograms
Histograms show the distribution of your data across frequency buckets rather than as a single average. This helps you understand data point grouping by frequency, not just averages. The `histogram()` function takes three arguments:
1. The attribute you want to plot (such as duration).
2. The maximum value of the range you want to consider (such as "1" for 1 second or less).
3. The number of buckets you want data grouped in.
In this example, you create a `histogram()` chart for all duration values between 0 and 1 second, grouping them into 50ms buckets. You do this by specifying "20" for the number of buckets. All the durations larger than 1 second group together in the last bucket.
````sql
SELECT histogram(duration, 1, 20)
FROM Public_APICall
SINCE 1 day ago
```
````

### Apdex
The `apdex()` function calculates an Apdex score on any numerical value (such as duration). You can calculate Apdex for one or more specific transactions to account for custom attribute values. You can even provide your own Apdex-T value without interfering with application settings. In this example, you provide the function with an attribute of "duration" and an Apdex-T value of 0.01, reporting it as "Apdex of Duration":
````sql
SELECT apdex(duration, 0.1) AS 'Apdex Of Duration'
FROM Public_APICall
SINCE 1 week ago
```
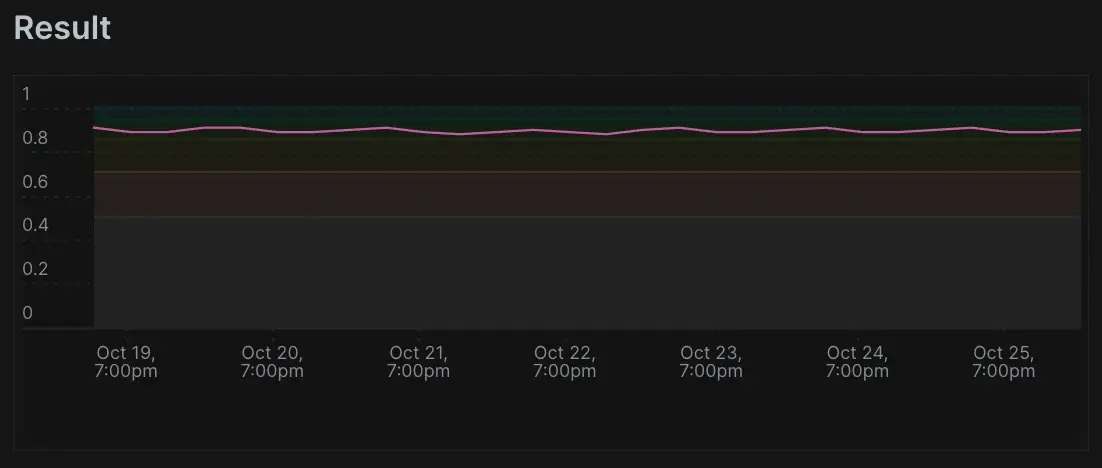
 You can also add the `TIMESERIES` operator to chart the data over time. Notice this also plots the Apdex satisfied, tolerating, and frustrated thresholds.
```sql
SELECT apdex(duration, 0.1) AS 'Apdex Of Duration'
FROM Public_APICall
SINCE 1 week ago
TIMESERIES
```
You can also add the `TIMESERIES` operator to chart the data over time. Notice this also plots the Apdex satisfied, tolerating, and frustrated thresholds.
```sql
SELECT apdex(duration, 0.1) AS 'Apdex Of Duration'
FROM Public_APICall
SINCE 1 week ago
TIMESERIES
```
 ````
You've now explored a whole new set of visualizations with `funnel()` and `histogram()`. You also learned how `filter()` can help you get more specific in queries with `WHERE` clauses and how `rate()` can display the rate of an attribute over time.
These queries build on your NRQL knowledge. Apdex is an industry standard and applies to many scenarios. Funnels can track progress through desired paths while histograms visualize the distribution of the data. Finally, filters let you narrow your returned values precisely. Next, you'll learn about `EXTRAPOLATE`.
## Use extrapolate for large amounts of data
The New Relic Database (NRDB) receives and processes large amounts of data every day. When APM records a large amount of event data, New Relic agents implement a sampling technique to continue collecting meaningful data while reducing potential impact to your applications. This usually only happens when a single event in an application or service handles extremely high volumes of requests.
If you have multiple agents spread across multiple load-balanced instances of a service, you may never even observe this limit. Let's find out what you can do when this happens. The `EXTRAPOLATE` operator tells New Relic to mathematically compensate for the effects of sampling, thereby returning results that more closely represent activity in your system. You can store an extra value to record how many similar events occurred over the limit, which allows you to return an estimate that accounts for unsampled data.
```sql
SELECT count(*)
FROM Transaction
SINCE 60 minutes ago
FACET appName
TIMESERIES 1 minute
EXTRAPOLATE
```
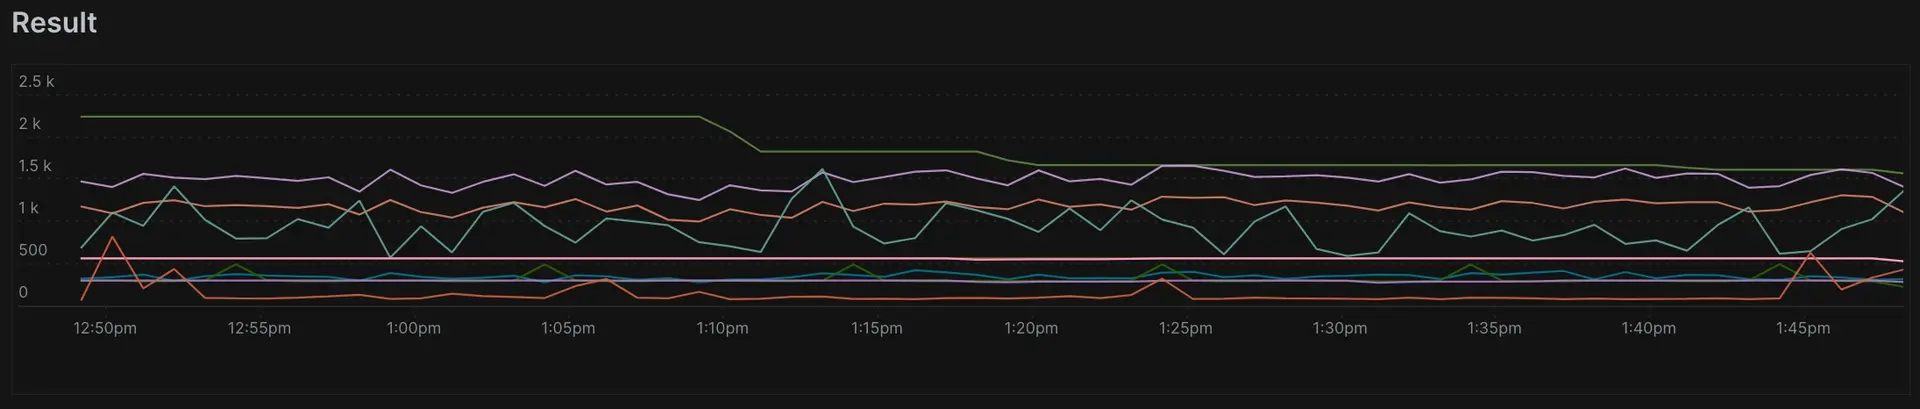
You might think that you may hit the limit by doing this. Try removing `EXTRAPOLATE` from the query, and see if your count changes. If it doesn't, you most likely haven't reached the limit.
When you include `EXTRAPOLATE` in a query, we calculate the ratio between the reported events and the total events. We then use this ratio to extrapolate an approximation of unsampled data. Keep in mind that only some queries support this use. When included in a NRQL query that doesn't support it or doesn't use sampled data, it has no effect.
Homogeneous data like throughput gets the most out of the `EXTRAPOLATE` function. It has less effect when attempting to extrapolate a count of distinct things (like `uniqueCount()` or `uniques()`). So, `EXTRAPOLATE` only works with NRQL queries that use one of the following aggregator functions:
- `apdex`
- `average`
- `count`
- `histogram`
- `sum`
- `percentage`
- `rate`
- `stddev`
With `EXTRAPOLATE` finished, let's move on to using facet cases.
## Use facet cases
1. As you learned previously, `FACET` both segments your data and helps you understand it from differently grouped perspectives (such as seeing average response time based on different response codes). When you use `FACET`, NRDB organizes data into groups based on the values of provided attributes. But what if you wanted to group different values together, such as HTTP response codes 200 and 201?
`FACET CASES()` solves for this issue by allowing you to choose how facet buckets are broken out. The operator takes any number of parameters in the format `WHERE attr OP value`. In the example below, you categorize all transactions with `http.url` starting with "amazon", "google", and "microsoft" into a bucket. You could also do this for things like error response codes to group our data in ways that increase readability and help us understand what's happening in our application(s).
````sql
SELECT count(*)
FROM Public_APICall
FACET CASES(WHERE http.url LIKE '%amazon%', WHERE http.url LIKE '%google%', WHERE http.url LIKE '%microsoft%')
```
````
You've now explored a whole new set of visualizations with `funnel()` and `histogram()`. You also learned how `filter()` can help you get more specific in queries with `WHERE` clauses and how `rate()` can display the rate of an attribute over time.
These queries build on your NRQL knowledge. Apdex is an industry standard and applies to many scenarios. Funnels can track progress through desired paths while histograms visualize the distribution of the data. Finally, filters let you narrow your returned values precisely. Next, you'll learn about `EXTRAPOLATE`.
## Use extrapolate for large amounts of data
The New Relic Database (NRDB) receives and processes large amounts of data every day. When APM records a large amount of event data, New Relic agents implement a sampling technique to continue collecting meaningful data while reducing potential impact to your applications. This usually only happens when a single event in an application or service handles extremely high volumes of requests.
If you have multiple agents spread across multiple load-balanced instances of a service, you may never even observe this limit. Let's find out what you can do when this happens. The `EXTRAPOLATE` operator tells New Relic to mathematically compensate for the effects of sampling, thereby returning results that more closely represent activity in your system. You can store an extra value to record how many similar events occurred over the limit, which allows you to return an estimate that accounts for unsampled data.
```sql
SELECT count(*)
FROM Transaction
SINCE 60 minutes ago
FACET appName
TIMESERIES 1 minute
EXTRAPOLATE
```

You might think that you may hit the limit by doing this. Try removing `EXTRAPOLATE` from the query, and see if your count changes. If it doesn't, you most likely haven't reached the limit.
When you include `EXTRAPOLATE` in a query, we calculate the ratio between the reported events and the total events. We then use this ratio to extrapolate an approximation of unsampled data. Keep in mind that only some queries support this use. When included in a NRQL query that doesn't support it or doesn't use sampled data, it has no effect.
Homogeneous data like throughput gets the most out of the `EXTRAPOLATE` function. It has less effect when attempting to extrapolate a count of distinct things (like `uniqueCount()` or `uniques()`). So, `EXTRAPOLATE` only works with NRQL queries that use one of the following aggregator functions:
- `apdex`
- `average`
- `count`
- `histogram`
- `sum`
- `percentage`
- `rate`
- `stddev`
With `EXTRAPOLATE` finished, let's move on to using facet cases.
## Use facet cases
1. As you learned previously, `FACET` both segments your data and helps you understand it from differently grouped perspectives (such as seeing average response time based on different response codes). When you use `FACET`, NRDB organizes data into groups based on the values of provided attributes. But what if you wanted to group different values together, such as HTTP response codes 200 and 201?
`FACET CASES()` solves for this issue by allowing you to choose how facet buckets are broken out. The operator takes any number of parameters in the format `WHERE attr OP value`. In the example below, you categorize all transactions with `http.url` starting with "amazon", "google", and "microsoft" into a bucket. You could also do this for things like error response codes to group our data in ways that increase readability and help us understand what's happening in our application(s).
````sql
SELECT count(*)
FROM Public_APICall
FACET CASES(WHERE http.url LIKE '%amazon%', WHERE http.url LIKE '%google%', WHERE http.url LIKE '%microsoft%')
```
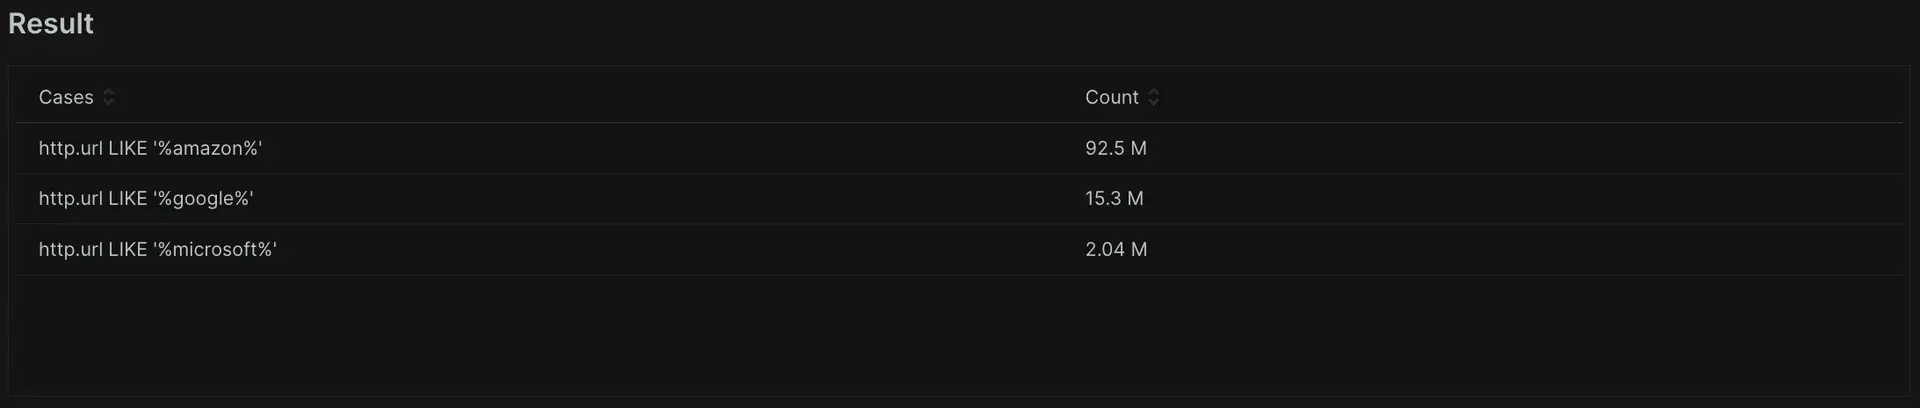 ````
2. As you can see, these groupings have value but you may have difficulty reading them. Let's clean them up using something we learned in a [previous tutorial](https://docs.newrelic.com/docs/query-your-data/nrql-new-relic-query-language/get-started/nrql-tutorial-process-your-data/):
````sql
SELECT count(*)
FROM Public_APICall
FACET CASES(WHERE http.url LIKE '%amazon%' AS 'Amazon', WHERE http.url LIKE '%google%' AS 'Google', WHERE http.url LIKE '%microsoft%' AS 'Microsoft')
```
````
2. As you can see, these groupings have value but you may have difficulty reading them. Let's clean them up using something we learned in a [previous tutorial](https://docs.newrelic.com/docs/query-your-data/nrql-new-relic-query-language/get-started/nrql-tutorial-process-your-data/):
````sql
SELECT count(*)
FROM Public_APICall
FACET CASES(WHERE http.url LIKE '%amazon%' AS 'Amazon', WHERE http.url LIKE '%google%' AS 'Google', WHERE http.url LIKE '%microsoft%' AS 'Microsoft')
```
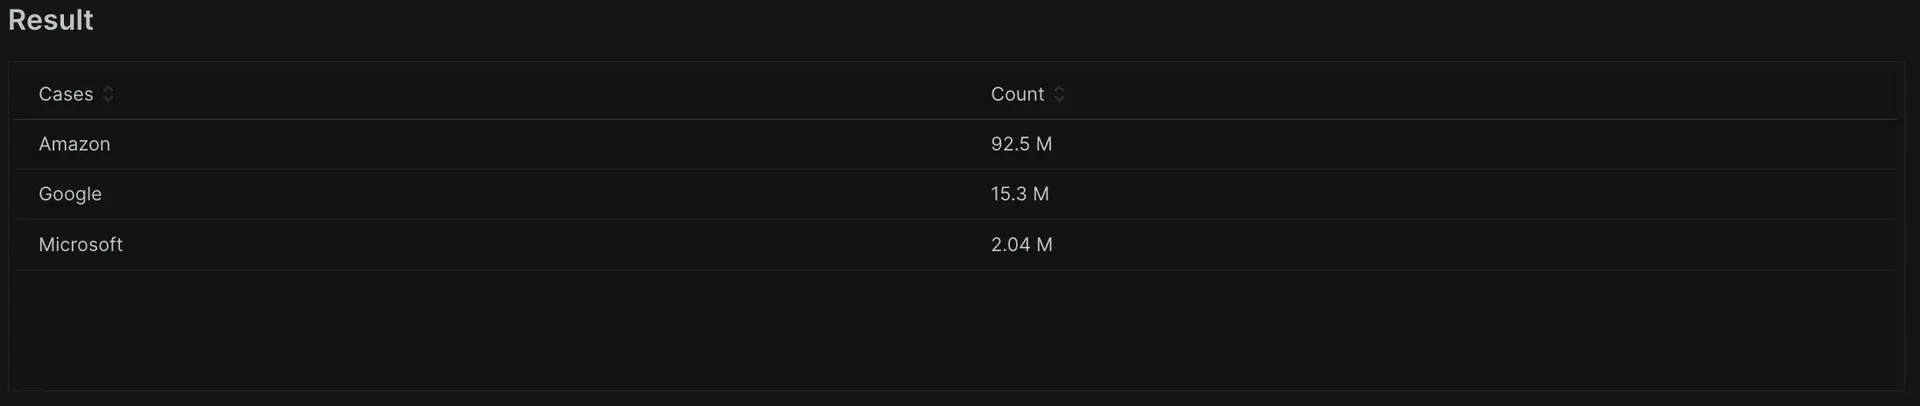 ````
`FACET CASES()` allows you to match and group attributes with differing values that you want to combine. This functionality has many uses, and it becomes even more useful when you tag custom data onto your transaction data. This allows you more granularity and control in navigating and grouping data. Next, you'll look further into filtering, this time by event type.
## Filter by event type
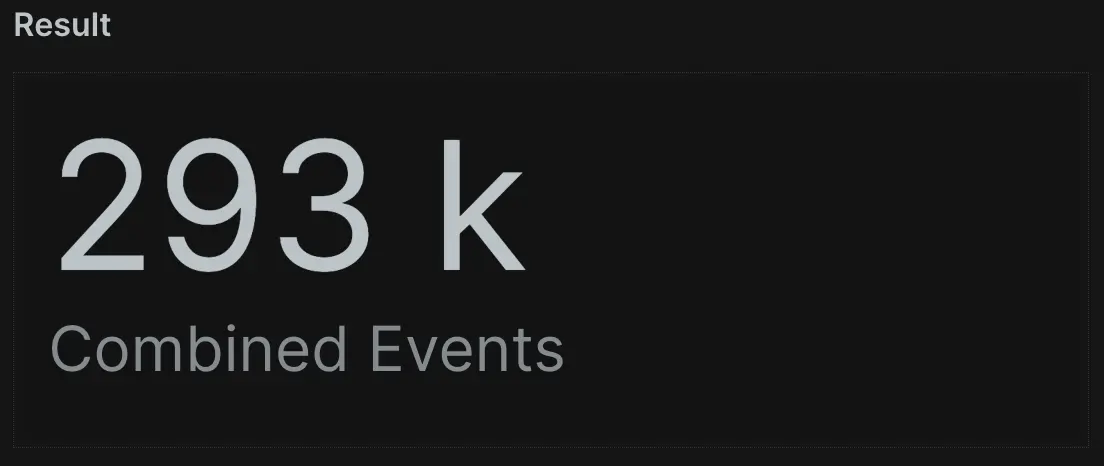
1. Now you'll explore something few New Relic customers are even aware of: filtering to event types! So far, you've made queries that pull data from a single source. But what if you want to plot 2 data points stored as two different event types? Querying NRDB data has no limits on a single event type, and you can query from different event types by separating them with commas.
````sql
SELECT count(*) AS 'Combined Events'
FROM NrdbQuery, NrDailyUsage
SINCE 1 day ago
```
````
2. To make this even more useful, the `eventType()` function tells you which event type the record comes from. You can use this to control your data output. In this example, you can see the total number of `Transaction` and `PageView` events combined, as well as the totals for only `Transaction` and `PageView`.
````sql
SELECT count(*) AS 'Combined Events', filter(count(*), WHERE eventType() = 'PageView') AS 'Page Views', filter(count(*), WHERE eventType()='Transaction') AS 'Transactions'
FROM Transaction, PageView
SINCE 1 day ago
```
````
`FACET CASES()` allows you to match and group attributes with differing values that you want to combine. This functionality has many uses, and it becomes even more useful when you tag custom data onto your transaction data. This allows you more granularity and control in navigating and grouping data. Next, you'll look further into filtering, this time by event type.
## Filter by event type
1. Now you'll explore something few New Relic customers are even aware of: filtering to event types! So far, you've made queries that pull data from a single source. But what if you want to plot 2 data points stored as two different event types? Querying NRDB data has no limits on a single event type, and you can query from different event types by separating them with commas.
````sql
SELECT count(*) AS 'Combined Events'
FROM NrdbQuery, NrDailyUsage
SINCE 1 day ago
```
````

2. To make this even more useful, the `eventType()` function tells you which event type the record comes from. You can use this to control your data output. In this example, you can see the total number of `Transaction` and `PageView` events combined, as well as the totals for only `Transaction` and `PageView`.
````sql
SELECT count(*) AS 'Combined Events', filter(count(*), WHERE eventType() = 'PageView') AS 'Page Views', filter(count(*), WHERE eventType()='Transaction') AS 'Transactions'
FROM Transaction, PageView
SINCE 1 day ago
```
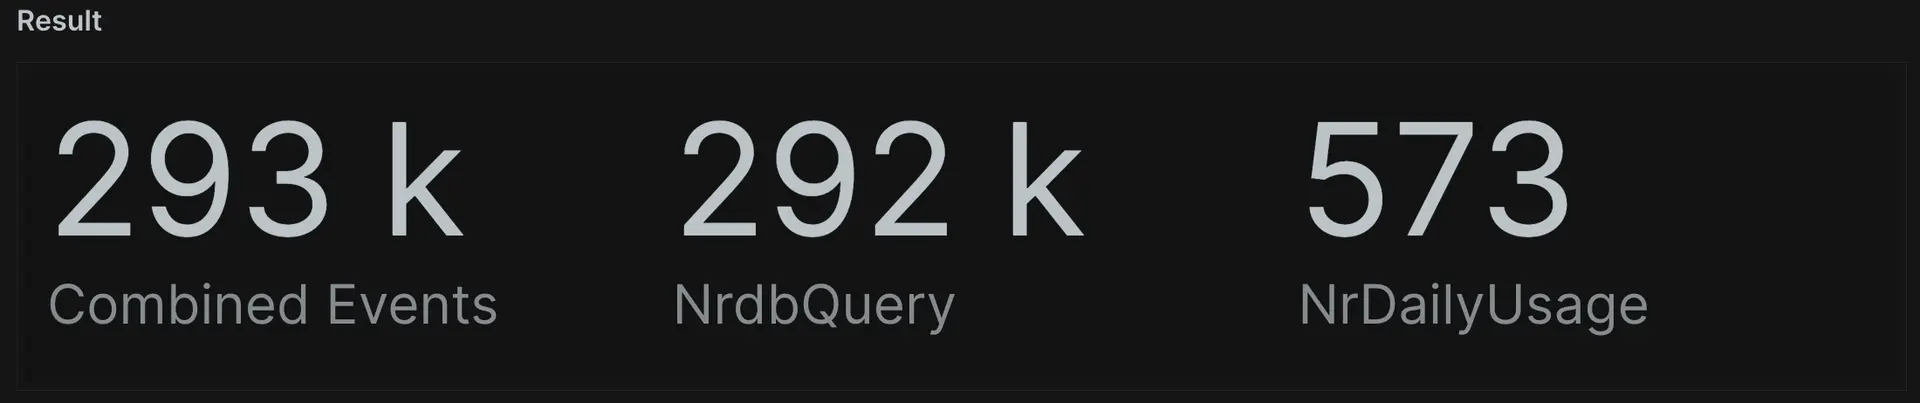 ````
3. Let's look at this in more detail: `count(*)` shows the total number of both `Transaction` and `PageView` events. However, you can use the aggregator function `filter()` you recently learned about to do something unique. The query has `WHERE eventType()='PageView'`, which invokes the filter function to observe the event type as part of the total result set. It then filters to display only those specific events. You can even add `TIMESERIES` to visualize 2 directly comparable data points on a line graph.
````sql
SELECT count(*) AS 'Combined Events', filter(count(*), WHERE eventType() = 'PageView') AS 'Page Views', filter(count(*), WHERE eventType()='Transaction') AS 'Transactions'
FROM Transaction
SINCE 1 day ago
TIMESERIES max
```
````
3. Let's look at this in more detail: `count(*)` shows the total number of both `Transaction` and `PageView` events. However, you can use the aggregator function `filter()` you recently learned about to do something unique. The query has `WHERE eventType()='PageView'`, which invokes the filter function to observe the event type as part of the total result set. It then filters to display only those specific events. You can even add `TIMESERIES` to visualize 2 directly comparable data points on a line graph.
````sql
SELECT count(*) AS 'Combined Events', filter(count(*), WHERE eventType() = 'PageView') AS 'Page Views', filter(count(*), WHERE eventType()='Transaction') AS 'Transactions'
FROM Transaction
SINCE 1 day ago
TIMESERIES max
```
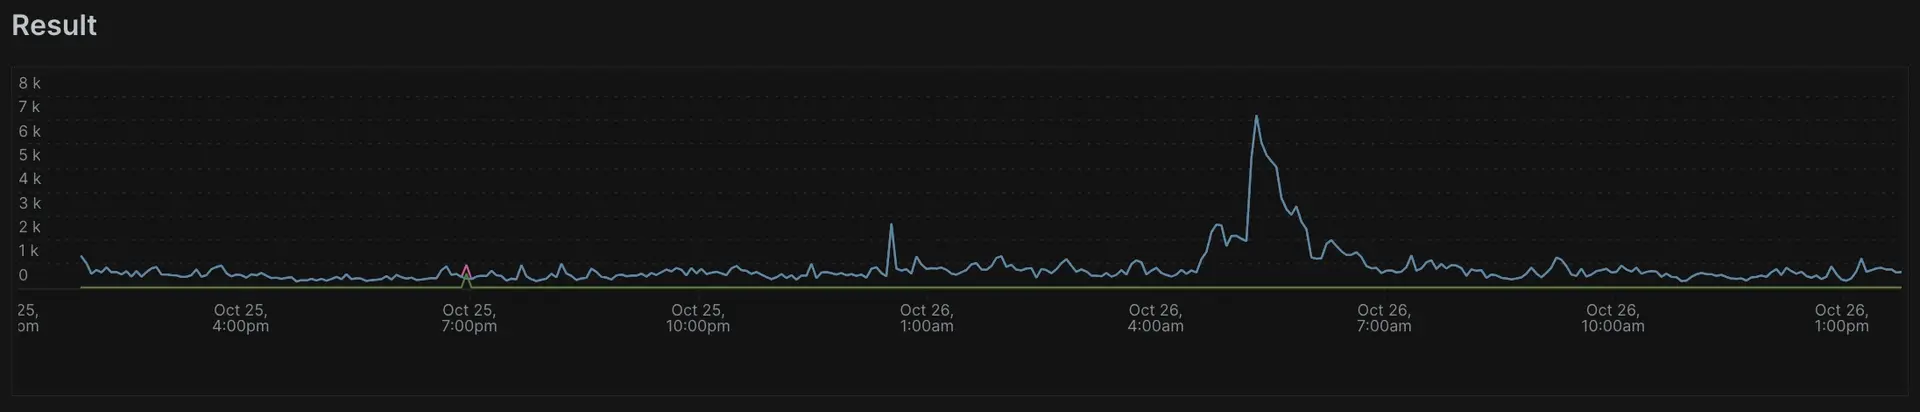 ````
You've now located, returned, and graphed data from two different event types. This example shows how NRQL lets you navigate any necessary data. No complex join statements are required. Next, learn how to use override values.
## Override values
### Count NULL values
Sometimes data fails to report in the format you need. For instance, integers may return as strings when you need them as integers to perform math. Or, a `NULL` result may represent 0 in your data. NRQL provides functions to handle these cases.
`NULL` values on attributes can appear on both out-of-the-box and custom data. When you use aggregators such as `count()` and `average()`, NRQL automatically removes `NULL` values from the calculation, only performing the function on events without `NULL` values. NRQL lets you account for unexpected `NULL` values in calculations by using the `OR value` clause. For example, if you wanted to make sure `NULL` values for a `cartValue` attribute count as 0, you could use `cartValue OR 0` in your query.
In this example, running `count()` on "http.url" only counts the number of times "http.url" has a value. But if you add `OR 'Null'` to the query, you can count all transactions where "http.url" exists, and also those a `NULL` value.
````sql
SELECT count(duration) AS 'Events With Durations', count(http.url OR 'Null') AS 'Events With and Without URL'
FROM Public_APICall
SINCE 1 day ago
```
````
You've now located, returned, and graphed data from two different event types. This example shows how NRQL lets you navigate any necessary data. No complex join statements are required. Next, learn how to use override values.
## Override values
### Count NULL values
Sometimes data fails to report in the format you need. For instance, integers may return as strings when you need them as integers to perform math. Or, a `NULL` result may represent 0 in your data. NRQL provides functions to handle these cases.
`NULL` values on attributes can appear on both out-of-the-box and custom data. When you use aggregators such as `count()` and `average()`, NRQL automatically removes `NULL` values from the calculation, only performing the function on events without `NULL` values. NRQL lets you account for unexpected `NULL` values in calculations by using the `OR value` clause. For example, if you wanted to make sure `NULL` values for a `cartValue` attribute count as 0, you could use `cartValue OR 0` in your query.
In this example, running `count()` on "http.url" only counts the number of times "http.url" has a value. But if you add `OR 'Null'` to the query, you can count all transactions where "http.url" exists, and also those a `NULL` value.
````sql
SELECT count(duration) AS 'Events With Durations', count(http.url OR 'Null') AS 'Events With and Without URL'
FROM Public_APICall
SINCE 1 day ago
```
 ````
1. You've almost learned everything you need to help you advance your dashboarding! Next up, you'll learn how to use coercion.
### Coercion
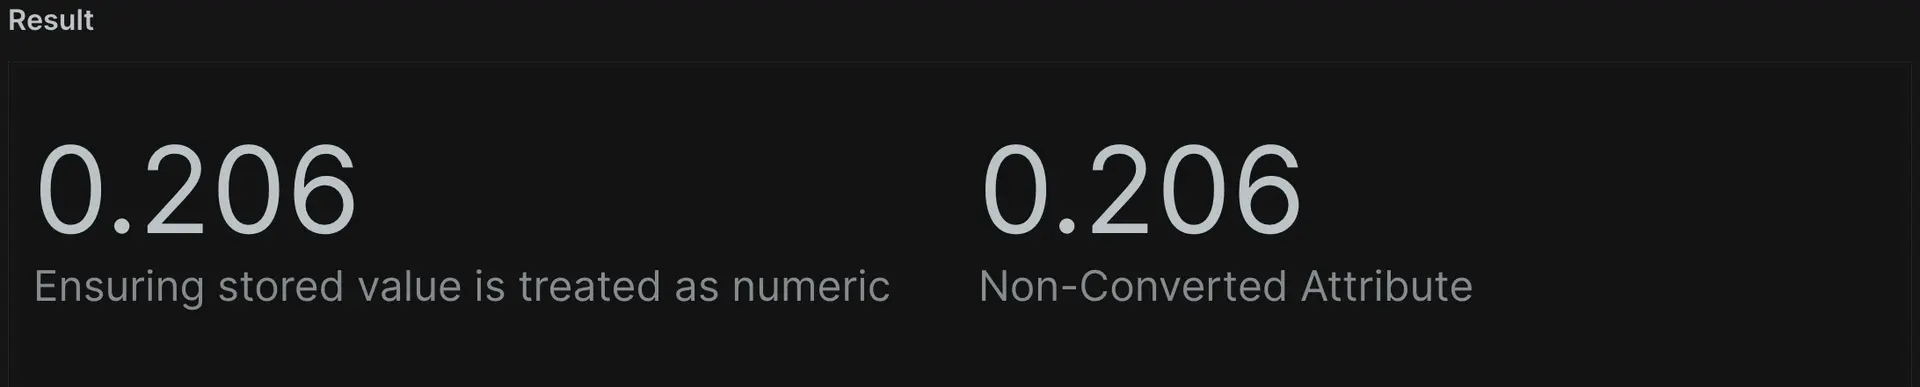
NRQL doesn't automatically apply coercion. This means we treat a float stored as a string as we would any other string, and you can't use them with mathematical functions like `sum()` or `average()`. To override this behavior, use `boolean()` or `numeric()` to convert arguments to boolean or numerical values. In this example, an `average()` function on "duration" provides no value since this attribute is a string. But if you convert the attribute to a number using `numeric(duration)`, you can use the `average()` function successfully.
````sql
SELECT average(numeric(duration)) AS 'Ensuring stored value is treated as numeric', average(duration) AS 'Non-Converted Attribute'
FROM Public_APICall
SINCE 1 day ago
```
````
1. You've almost learned everything you need to help you advance your dashboarding! Next up, you'll learn how to use coercion.
### Coercion
NRQL doesn't automatically apply coercion. This means we treat a float stored as a string as we would any other string, and you can't use them with mathematical functions like `sum()` or `average()`. To override this behavior, use `boolean()` or `numeric()` to convert arguments to boolean or numerical values. In this example, an `average()` function on "duration" provides no value since this attribute is a string. But if you convert the attribute to a number using `numeric(duration)`, you can use the `average()` function successfully.
````sql
SELECT average(numeric(duration)) AS 'Ensuring stored value is treated as numeric', average(duration) AS 'Non-Converted Attribute'
FROM Public_APICall
SINCE 1 day ago
```
 ````
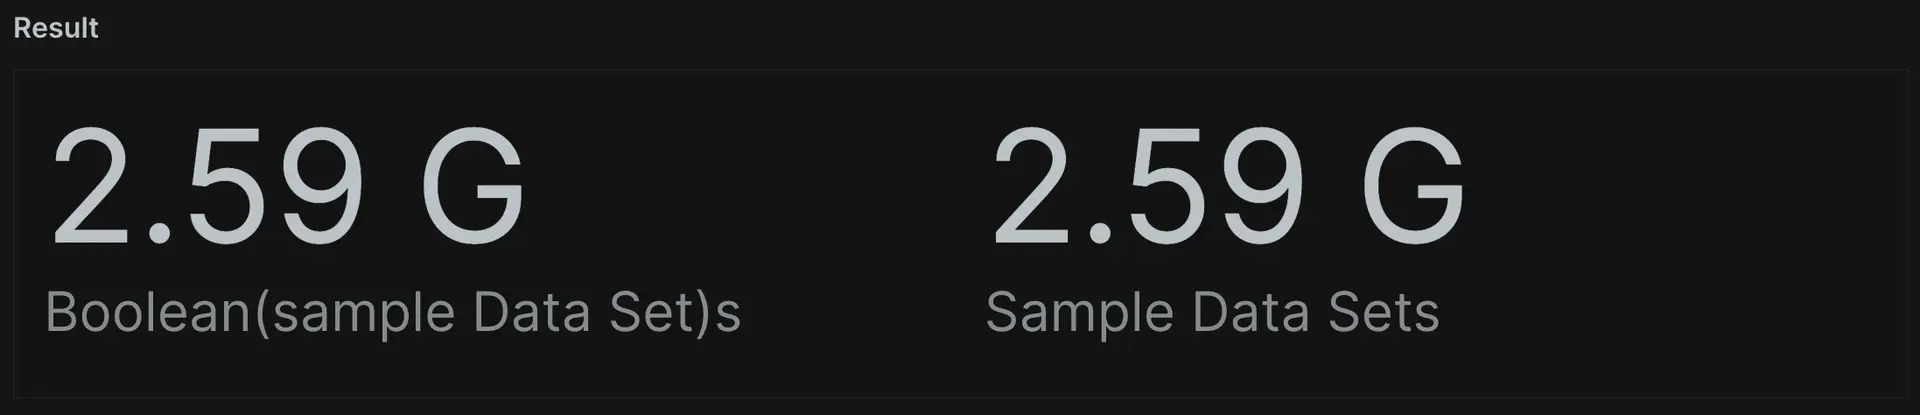
2. Another common example is `BOOLEAN` (TRUE or FALSE) values, which often incorrectly format as strings. When this happens, you can change how the source sends the data to make it a proper boolean. Or, you can use the `boolean()` function. The example query below returns the same result, but only because you use a value the agent sends as a `BOOLEAN`. If your attribute was a string "TRUE", `boolean()` would convert it into a proper boolean format, allowing the query to run as intended.
````sql
SELECT count(boolean(sampleDataSet)), count(sampleDataSet)
FROM Public_APICall
SINCE 24 hours ago
```
````
2. Another common example is `BOOLEAN` (TRUE or FALSE) values, which often incorrectly format as strings. When this happens, you can change how the source sends the data to make it a proper boolean. Or, you can use the `boolean()` function. The example query below returns the same result, but only because you use a value the agent sends as a `BOOLEAN`. If your attribute was a string "TRUE", `boolean()` would convert it into a proper boolean format, allowing the query to run as intended.
````sql
SELECT count(boolean(sampleDataSet)), count(sampleDataSet)
FROM Public_APICall
SINCE 24 hours ago
```
 ````
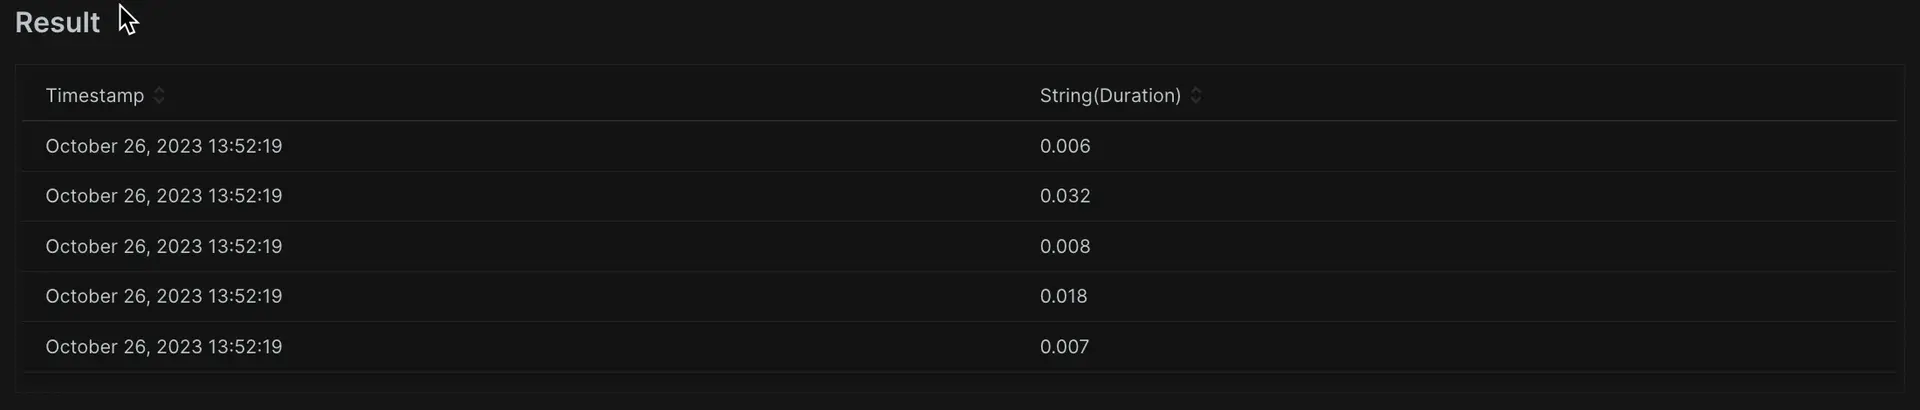
3. You can also convert boolean and numeric values to strings by using the `string()` function. With numeric values as floating-point numbers, you can use the optional `precision` argument to limit the number of decimal places for the string. This query returns the duration value as a string limited to three decimal places.
````sql
SELECT string(duration, precision: 3)
FROM Public_APICall
SINCE 24 hours ago
```
````
3. You can also convert boolean and numeric values to strings by using the `string()` function. With numeric values as floating-point numbers, you can use the optional `precision` argument to limit the number of decimal places for the string. This query returns the duration value as a string limited to three decimal places.
````sql
SELECT string(duration, precision: 3)
FROM Public_APICall
SINCE 24 hours ago
```
 ````
You can now control your data formats and tell NRQL how you want it to act. NRQL operates in the manner we deem most logical, but if that doesn't suit your unique scenario, you can use the functions explored in this lesson to override those values. You have only one thing left to learn: string concatenation.
## Use string concatenation to append arguments
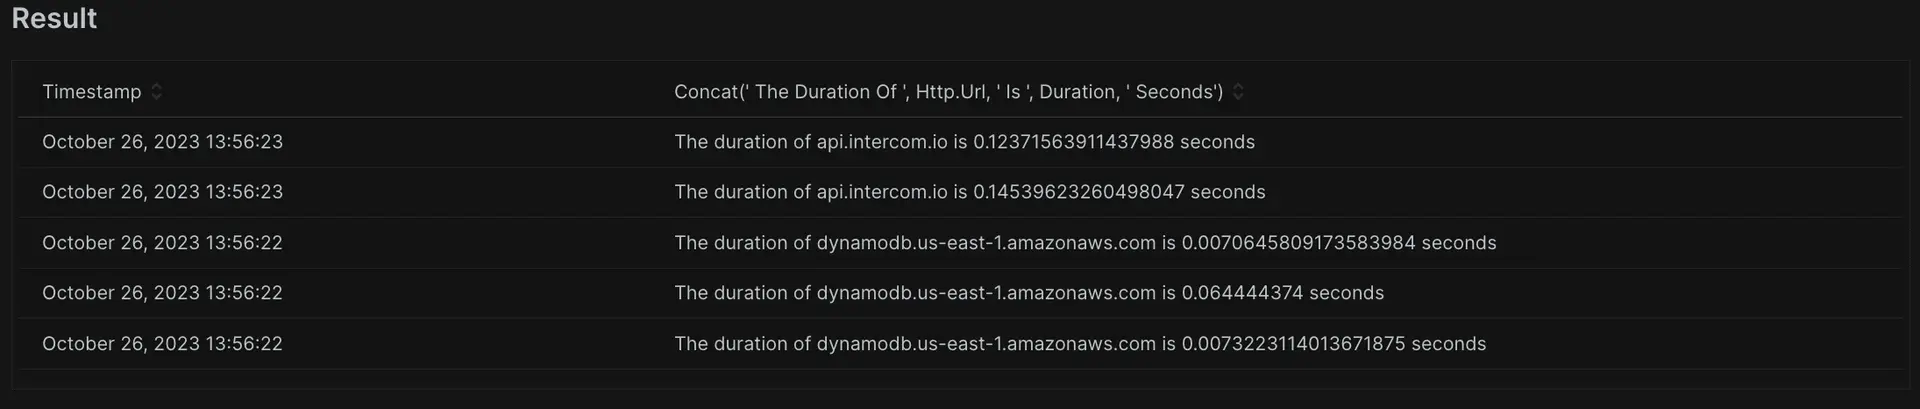
1. There may be some cases where you need to append or prepend text to the returned value of an attribute. You can achieve this using the `concat()` function. You can provide up to 20 arguments for the `concat()` function to concatenate into a string.
````sql
SELECT concat('The duration of ', http.url, ' is ', duration, ' seconds')
FROM Public_APICall
```
````
You can now control your data formats and tell NRQL how you want it to act. NRQL operates in the manner we deem most logical, but if that doesn't suit your unique scenario, you can use the functions explored in this lesson to override those values. You have only one thing left to learn: string concatenation.
## Use string concatenation to append arguments
1. There may be some cases where you need to append or prepend text to the returned value of an attribute. You can achieve this using the `concat()` function. You can provide up to 20 arguments for the `concat()` function to concatenate into a string.
````sql
SELECT concat('The duration of ', http.url, ' is ', duration, ' seconds')
FROM Public_APICall
```
 ````
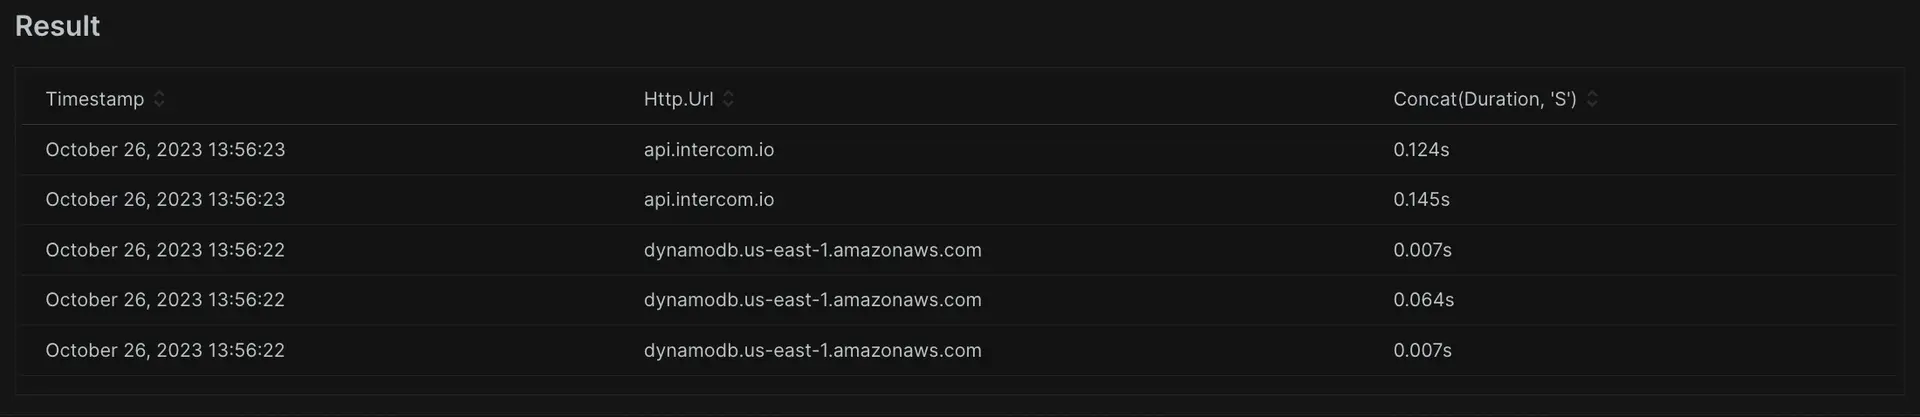
2. You can limit the number of decimal places that you use for any floating point numbers in the values of the concatenated attributes. To do this, you use the optional `precision:` argument as the last value. In this example, you append 's' to denote seconds, and limit the value to 3 decimal places.
````sql
SELECT http.url, concat(duration, 's', precision: 3)
FROM Public_APICall
```
````
2. You can limit the number of decimal places that you use for any floating point numbers in the values of the concatenated attributes. To do this, you use the optional `precision:` argument as the last value. In this example, you append 's' to denote seconds, and limit the value to 3 decimal places.
````sql
SELECT http.url, concat(duration, 's', precision: 3)
FROM Public_APICall
```
 ````
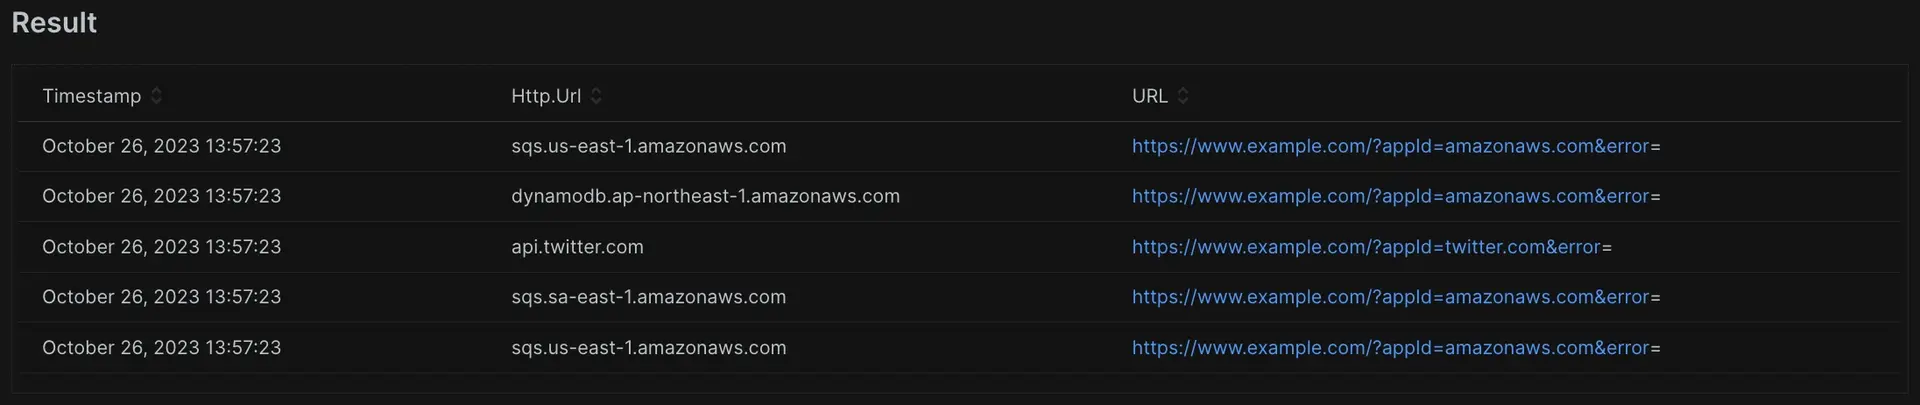
3. New Relic automatically displays values starting with `http(s)` as links you can click to open a new page, which means you can create integrations to solutions where a dynamic URL can open a related page to an entity. The following example demonstrates an example URL where you set the query parameter values by the attribute values.
````sql
SELECT http.url, concat('https://www.example.com/?appId=', api, '&error=', error) AS 'URL'
FROM Public_APICall
```
````
3. New Relic automatically displays values starting with `http(s)` as links you can click to open a new page, which means you can create integrations to solutions where a dynamic URL can open a related page to an entity. The following example demonstrates an example URL where you set the query parameter values by the attribute values.
````sql
SELECT http.url, concat('https://www.example.com/?appId=', api, '&error=', error) AS 'URL'
FROM Public_APICall
```
 You can use the `concat()` function to combine values together, such as a city and country for location, and prepend or append additional strings to present the data as you need.
````
In this tutorial, you explored advanced NRQL functionality. These skills apply to many real-world NRQL scenarios.
You've now completed the third NRQL tutorial. Whenever you're ready, the next and final tutorial in this series covers more advanced features: [NRQL advanced functions](https://docs.newrelic.com/docs/query-your-data/nrql-new-relic-query-language/get-started/nrql-tutorial-advanced-functions/).
You can use the `concat()` function to combine values together, such as a city and country for location, and prepend or append additional strings to present the data as you need.
````
In this tutorial, you explored advanced NRQL functionality. These skills apply to many real-world NRQL scenarios.
You've now completed the third NRQL tutorial. Whenever you're ready, the next and final tutorial in this series covers more advanced features: [NRQL advanced functions](https://docs.newrelic.com/docs/query-your-data/nrql-new-relic-query-language/get-started/nrql-tutorial-advanced-functions/).