---
title: Introductory NRQL tutorial: Your first queries
source: https://docs.newrelic.com/docs/nrql/nrql-tutorials/introduction-nrql-tutorial
---
After learning the basics of NRQL in our other topics, such as [what NRQL is](https://docs.newrelic.com/docs/query-your-data/nrql-new-relic-query-language/get-started/introduction-nrql-new-relics-query-language/), [how NRQL works](https://docs.newrelic.com/docs/query-your-data/nrql-new-relic-query-language/get-started/introduction-nrql-how-nrql-works/), and [how NRQL relates to charts and dashboards](https://docs.newrelic.com/docs/query-your-data/nrql-new-relic-query-language/get-started/charts-and-dashboards-with-nrql/), you're ready to try the examples in this tutorial! The tutorial covers some foundational concepts within the language to help you create some basic NRQL queries using your data, including how to:
- Use `SELECT` and `FROM`
- Use `LIMIT`
- Specify attributes
- Aggregate using `average()`, `max()`, `min()`, `sum()`, and `count()`
- Use `SINCE` and `UNTIL`
- Plot line graphs with `TIMESERIES`
- Filter using `WHERE`
- Group attributes using `FACET`
[Video](https://www.youtube.com/embed/3UHEHbprs6I)
### Prerequisites
You only need some data coming into the New Relic platform to follow along with this tutorial. If you're brand new to New Relic and want to see how easily you can use NRQL, you can get started with the platform for free and follow along with the tutorial. All you have to do is:
1. [Sign up for a free account](https://newrelic.com/signup) if you haven't already.
2. Use our [agents and integrations](https://docs.newrelic.com/docs/infrastructure/host-integrations/get-started/introduction-host-integrations/) to automatically collect data from any common frameworks and tools.
3. Visit the [quick launch guide](https://docs.newrelic.com/docs/new-relic-solutions/get-started/quick-launch-guide) for a recommended path on how to set up New Relic. You can start ingesting data to query, and then you're all set for using this or any of the other tutorials in this series.
Ready to get started? Let's go!
### 1. Create your first query
1. The best place to start in the [query builder](https://one.newrelic.com/data-exploration/query-builder) is by looking at a single event type in NRDB called `Transaction`, gathered by New Relic APM. Every NRQL query must have `SELECT` and `FROM` clauses: you must `SELECT` some data and tell us where it's `FROM`. Start with this basic query that selects everything from the `Transaction` event type:
````sql
SELECT *
FROM Transaction
```
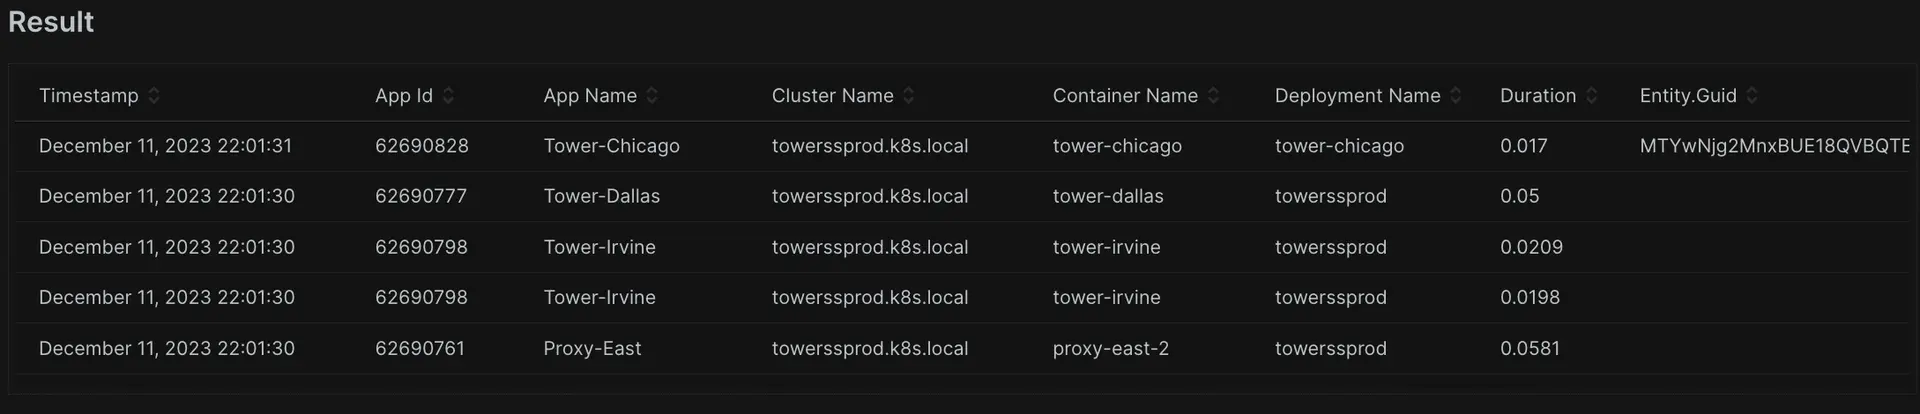 ````
2. This returns a lot of results, each with a timestamp and a collection of attributes. For now, you only want a single result, so you can limit the results to a single record using `LIMIT 1`.
````sql
SELECT *
FROM Transaction
LIMIT 1
```
````
2. This returns a lot of results, each with a timestamp and a collection of attributes. For now, you only want a single result, so you can limit the results to a single record using `LIMIT 1`.
````sql
SELECT *
FROM Transaction
LIMIT 1
```
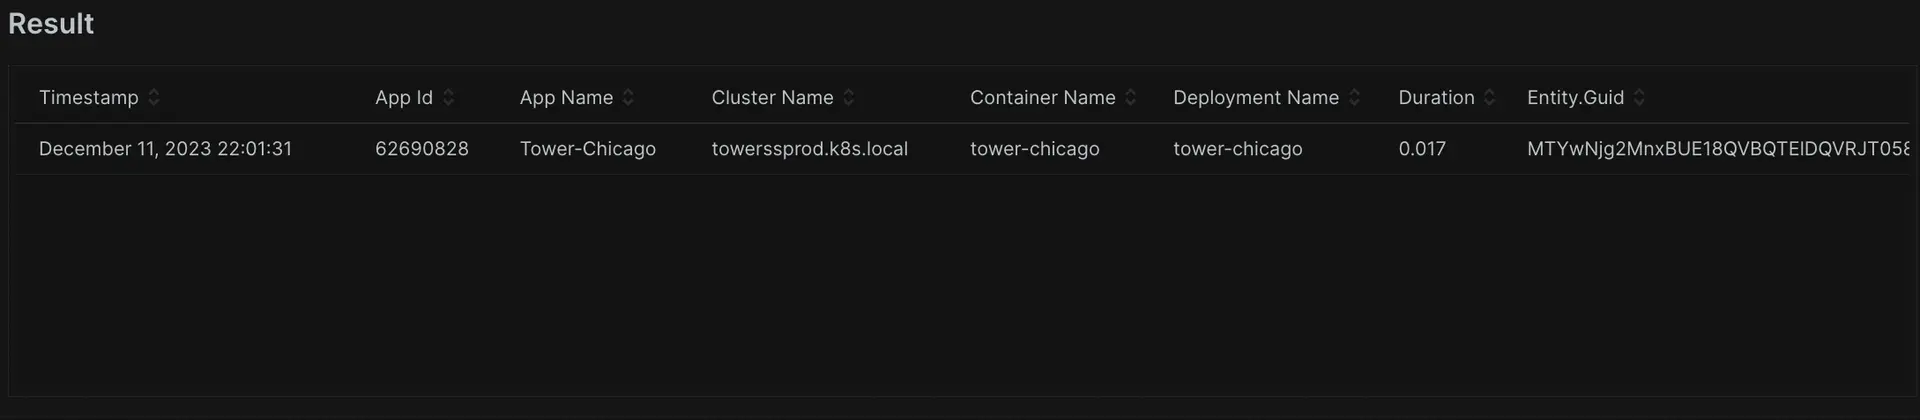 When a `LIMIT` isn't supplied, the query returns the default of 100 table rows for `SELECT *` queries or 10 aggregated values for `FACET` queries and `SELECT (attributes)` queries. You can specify any limit up to the maximum by using `LIMIT MAX`.
````
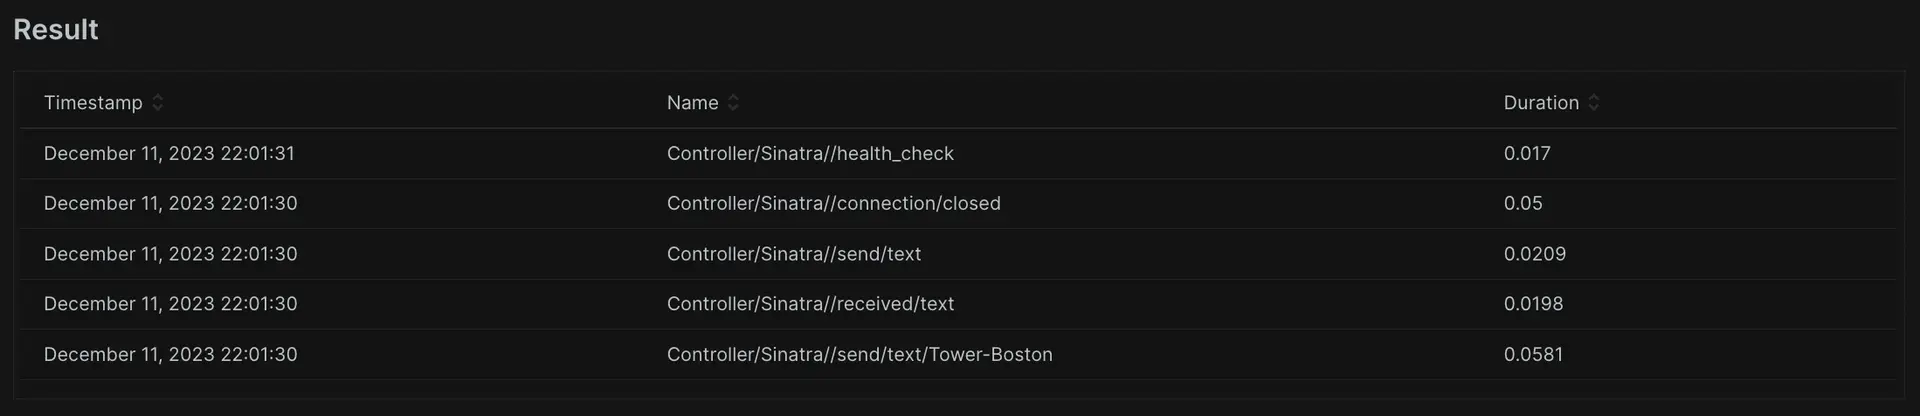
3. Now you have a way to control the volume of the results. But what if you don't want all the attributes? What if you want to see only specific data points? Like SQL, you can do this with only a few characters by replacing `*` with the name of the attribute(s) you want. In this case, you can ask for the name of a transaction and the duration of time it took.
````sql
SELECT name, duration
FROM Transaction
```
With this, you've written queries that can return either all or some specific attributes of an event, as well as querying a specific number of events. It's time for the next step: aggregating data.
When a `LIMIT` isn't supplied, the query returns the default of 100 table rows for `SELECT *` queries or 10 aggregated values for `FACET` queries and `SELECT (attributes)` queries. You can specify any limit up to the maximum by using `LIMIT MAX`.
````
3. Now you have a way to control the volume of the results. But what if you don't want all the attributes? What if you want to see only specific data points? Like SQL, you can do this with only a few characters by replacing `*` with the name of the attribute(s) you want. In this case, you can ask for the name of a transaction and the duration of time it took.
````sql
SELECT name, duration
FROM Transaction
```
With this, you've written queries that can return either all or some specific attributes of an event, as well as querying a specific number of events. It's time for the next step: aggregating data.
 ````
### 2. Aggregate data
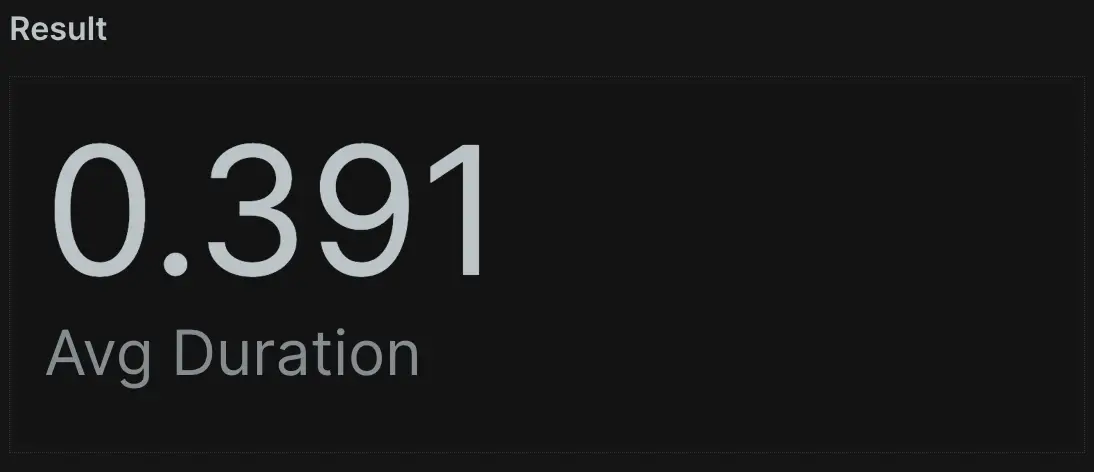
1. Sometimes, you may want to view summarized aggregate data across many events instead of viewing individual data points. Here's where NRDB shines. NRDB can scan billions of events and provide instant, real-time answers to questions about your data. For example, each `Transaction` event has a duration attribute that represents how many seconds the call took to execute. Use the following query to discover the average duration across all `Transaction` events:
````sql
SELECT average(duration)
FROM Transaction
```
````
2. NRQL has many built-in functions you can use to aggregate event data. Commonly used functions include `max()`, `min()`,`average()`, `median()`, and `percentile()`. You can use the following query to ask NRDB for the duration of the slowest transaction from the last 60 minutes. To do this, ask NRDB for the `max(duration).`
````sql
SELECT max(duration)
FROM Transaction
```
````
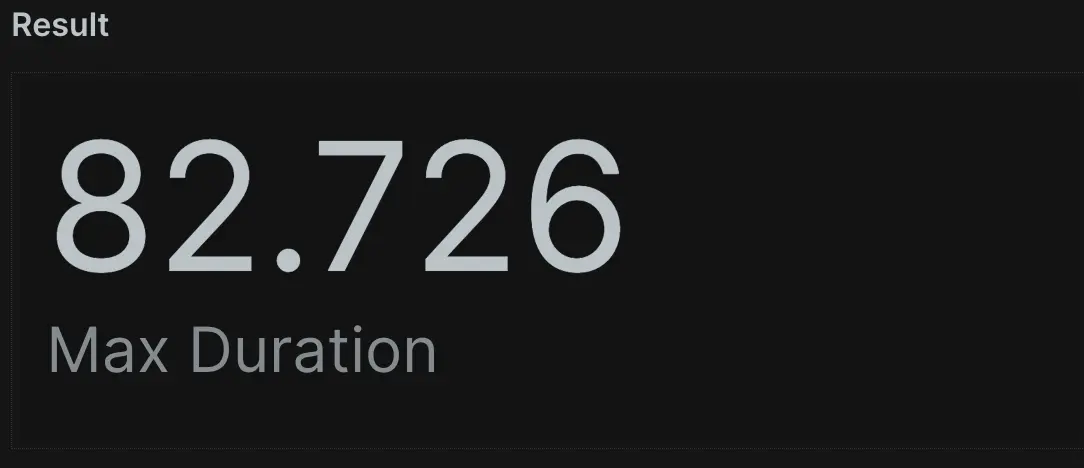
3. You now know how long the slowest customer experience in the last 60 minutes took. Next, find the inverse and see how long the fastest experience was by asking NRDB for the `min(duration)`.
````sql
SELECT min(duration)
FROM Transaction
```
````

4. As you can see, `max()` and `min()` both return important data points. But what if you want to perform arithmetic on the data? With `sum()`, you can do basic addition on a numeric attribute. In this query, use a new attribute called `databaseCallCount`. This attribute counts the number of database calls each transaction makes. By adding them, you can get the total volume of database calls in the default 60 minute time window (this will be 0 if your apps don't talk to a database).
````sql
SELECT sum(databaseCallCount)
FROM Transaction
```
````

5. Finally, you can also count all recorded transaction events with `count(*)`. Using this query, you can count all recorded events for all applications reporting to the New Relic APM:
````sql
SELECT count(*)
FROM Transaction
```
````

Now you can find out a lot about your data: you can measure the boundaries of your performance, group event data together, and even calculate information about your chosen attribute. You've chosen a duration and calculated the `average`, `max`, and `min` values, added numeric attributes, and counted all the events over a period of time. Manipulating data like this will help when you want to present data in visualizations, which assists in spotting performance issues. It's time for the next step: using time ranges.
### 3. Use time ranges
1. Every piece of data in NRDB has a `timestamp`, and every query operates on a subset of data within a time range. If you don't provide a time range in your NRQL query, it will return the last 60 minutes by default as we previously saw. But what if you want to see data from different time ranges? How do you control the window of data you see? You can do this by using `SINCE` and `UNTIL` keywords to provide a beginning and end to your query's time range.
````sql
SELECT average(duration)
FROM Transaction
SINCE 1 day ago
```
````

2. You can also specify time ranges relative to when you make queries by using keywords like `day`, `week`, `hour`, `minute`, or their plural equivalents. You can also use logical expressions like `SINCE today` or `SINCE this week`.
````sql
SELECT average(duration)
FROM Transaction
SINCE this week
```
````

3. Here is another query that demonstrates relative time ranges. Note that when specifying a relative time, you need to include the keyword `ago`.
````sql
SELECT average(duration)
FROM Transaction
SINCE 1 week ago
UNTIL 2 days ago
```
````

Now you have even more control of your data. By adding a time frame to a query, you've define exactly which window of data you want to see. These controls let you zero in on the data you want by defining where the data reporting starts and ends. You've also chosen the window and used common terms like `week`, `day`, `hour`, `minute`, and their plurals. It's time for the next step: querying a time series.
### 4. Query time series
1. A common NRQL use case is querying how values change over time. This type of query provides data for line charts, area charts, and other visualizations. You've already run some queries to explore aggregation functions `average()`, `max()`, `min()`, `sum()`, and `count()`. Now, use this example to see how to take any query made with aggregation functions and add the `TIMESERIES` keyword to plot the values over time.
````sql
SELECT average(duration)
FROM Transaction
SINCE 1 day ago
TIMESERIES
```
````
### 2. Aggregate data
1. Sometimes, you may want to view summarized aggregate data across many events instead of viewing individual data points. Here's where NRDB shines. NRDB can scan billions of events and provide instant, real-time answers to questions about your data. For example, each `Transaction` event has a duration attribute that represents how many seconds the call took to execute. Use the following query to discover the average duration across all `Transaction` events:
````sql
SELECT average(duration)
FROM Transaction
```
````

2. NRQL has many built-in functions you can use to aggregate event data. Commonly used functions include `max()`, `min()`,`average()`, `median()`, and `percentile()`. You can use the following query to ask NRDB for the duration of the slowest transaction from the last 60 minutes. To do this, ask NRDB for the `max(duration).`
````sql
SELECT max(duration)
FROM Transaction
```
````

3. You now know how long the slowest customer experience in the last 60 minutes took. Next, find the inverse and see how long the fastest experience was by asking NRDB for the `min(duration)`.
````sql
SELECT min(duration)
FROM Transaction
```
````

4. As you can see, `max()` and `min()` both return important data points. But what if you want to perform arithmetic on the data? With `sum()`, you can do basic addition on a numeric attribute. In this query, use a new attribute called `databaseCallCount`. This attribute counts the number of database calls each transaction makes. By adding them, you can get the total volume of database calls in the default 60 minute time window (this will be 0 if your apps don't talk to a database).
````sql
SELECT sum(databaseCallCount)
FROM Transaction
```
````

5. Finally, you can also count all recorded transaction events with `count(*)`. Using this query, you can count all recorded events for all applications reporting to the New Relic APM:
````sql
SELECT count(*)
FROM Transaction
```
````

Now you can find out a lot about your data: you can measure the boundaries of your performance, group event data together, and even calculate information about your chosen attribute. You've chosen a duration and calculated the `average`, `max`, and `min` values, added numeric attributes, and counted all the events over a period of time. Manipulating data like this will help when you want to present data in visualizations, which assists in spotting performance issues. It's time for the next step: using time ranges.
### 3. Use time ranges
1. Every piece of data in NRDB has a `timestamp`, and every query operates on a subset of data within a time range. If you don't provide a time range in your NRQL query, it will return the last 60 minutes by default as we previously saw. But what if you want to see data from different time ranges? How do you control the window of data you see? You can do this by using `SINCE` and `UNTIL` keywords to provide a beginning and end to your query's time range.
````sql
SELECT average(duration)
FROM Transaction
SINCE 1 day ago
```
````

2. You can also specify time ranges relative to when you make queries by using keywords like `day`, `week`, `hour`, `minute`, or their plural equivalents. You can also use logical expressions like `SINCE today` or `SINCE this week`.
````sql
SELECT average(duration)
FROM Transaction
SINCE this week
```
````

3. Here is another query that demonstrates relative time ranges. Note that when specifying a relative time, you need to include the keyword `ago`.
````sql
SELECT average(duration)
FROM Transaction
SINCE 1 week ago
UNTIL 2 days ago
```
````

Now you have even more control of your data. By adding a time frame to a query, you've define exactly which window of data you want to see. These controls let you zero in on the data you want by defining where the data reporting starts and ends. You've also chosen the window and used common terms like `week`, `day`, `hour`, `minute`, and their plurals. It's time for the next step: querying a time series.
### 4. Query time series
1. A common NRQL use case is querying how values change over time. This type of query provides data for line charts, area charts, and other visualizations. You've already run some queries to explore aggregation functions `average()`, `max()`, `min()`, `sum()`, and `count()`. Now, use this example to see how to take any query made with aggregation functions and add the `TIMESERIES` keyword to plot the values over time.
````sql
SELECT average(duration)
FROM Transaction
SINCE 1 day ago
TIMESERIES
```
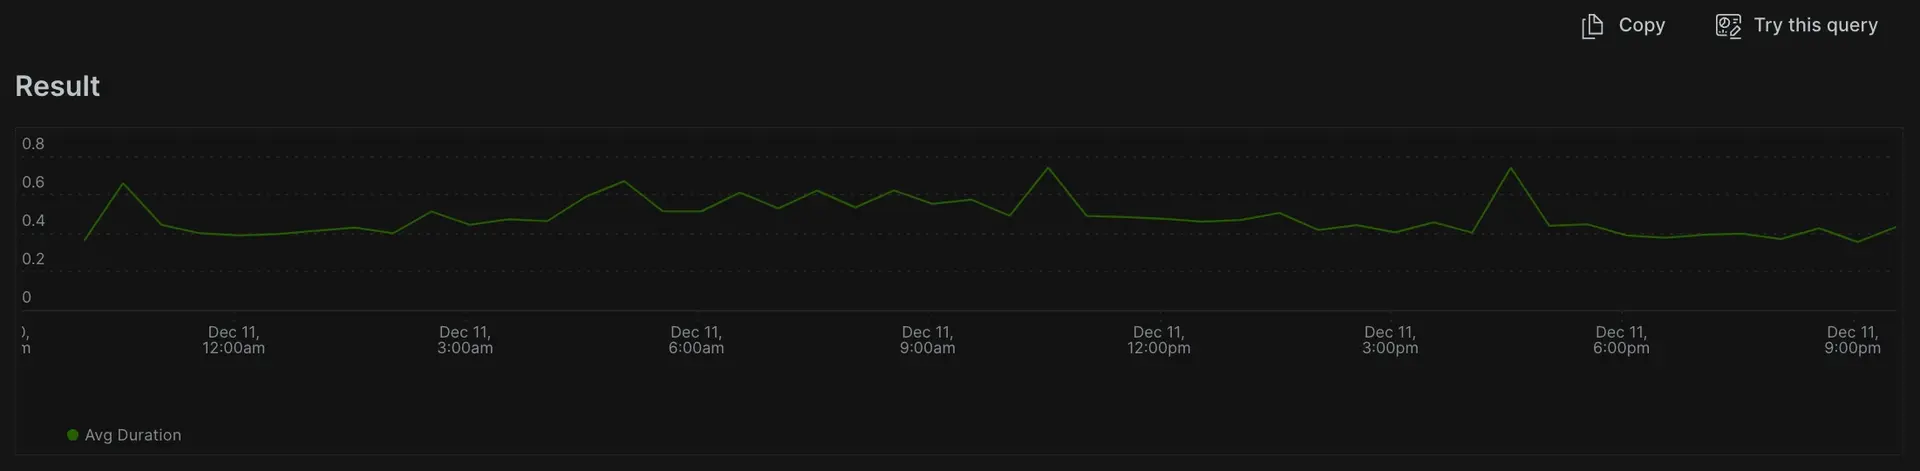 ````
2. A time series query breaks the data into a number of regions called buckets over the specified time period. You can have NRDB pick a value for the width of that bucket or choose your own. Use this query to ask NRDB to show the average duration of application transactions with returned data organized into 1-hour buckets.
````sql
SELECT average(duration)
FROM Transaction
SINCE 1 day ago
TIMESERIES 1 hour
```
````
2. A time series query breaks the data into a number of regions called buckets over the specified time period. You can have NRDB pick a value for the width of that bucket or choose your own. Use this query to ask NRDB to show the average duration of application transactions with returned data organized into 1-hour buckets.
````sql
SELECT average(duration)
FROM Transaction
SINCE 1 day ago
TIMESERIES 1 hour
```
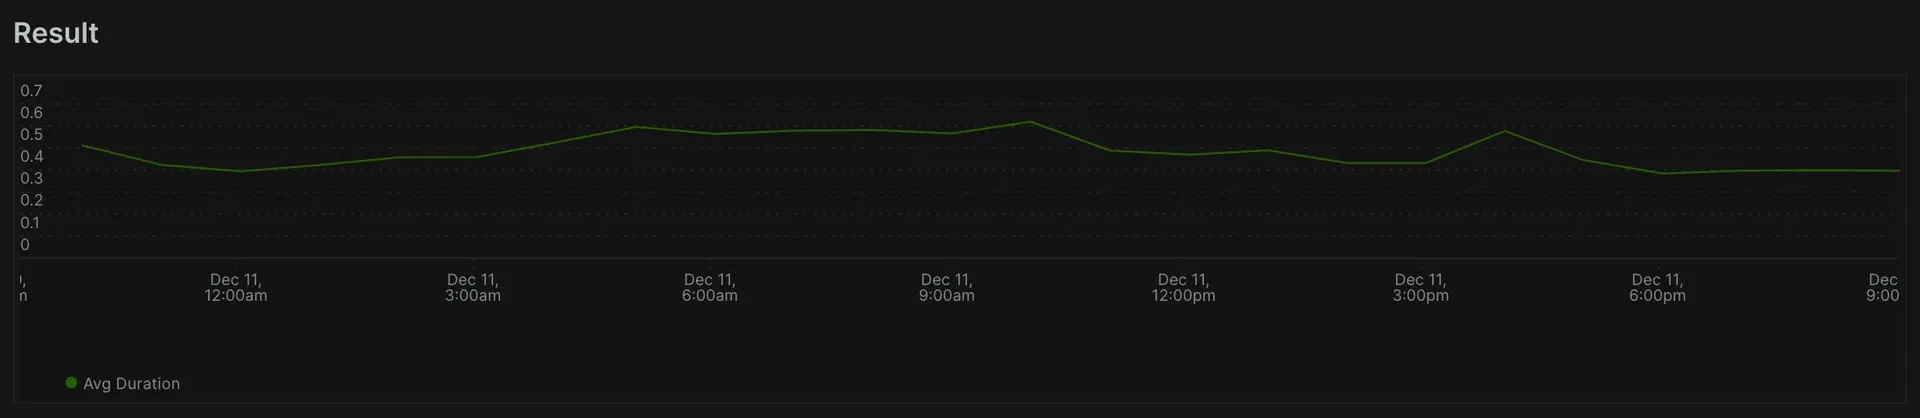 ````
3. Notice this may return a flatter graph, since we only have 24 data points across the 1-day period being plotted. But what if you want to see the maximum possible granularity? Any time series query can have up to 366 data buckets, meaning the maximum granularity possible for 24 hours is to bucket our data into 4 minute windows. Query this by using `TIMESERIES 4 minutes` or `TIMESERIES MAX`:
````sql
SELECT average(duration)
FROM Transaction
SINCE 1 day ago
TIMESERIES MAX
```
````
3. Notice this may return a flatter graph, since we only have 24 data points across the 1-day period being plotted. But what if you want to see the maximum possible granularity? Any time series query can have up to 366 data buckets, meaning the maximum granularity possible for 24 hours is to bucket our data into 4 minute windows. Query this by using `TIMESERIES 4 minutes` or `TIMESERIES MAX`:
````sql
SELECT average(duration)
FROM Transaction
SINCE 1 day ago
TIMESERIES MAX
```
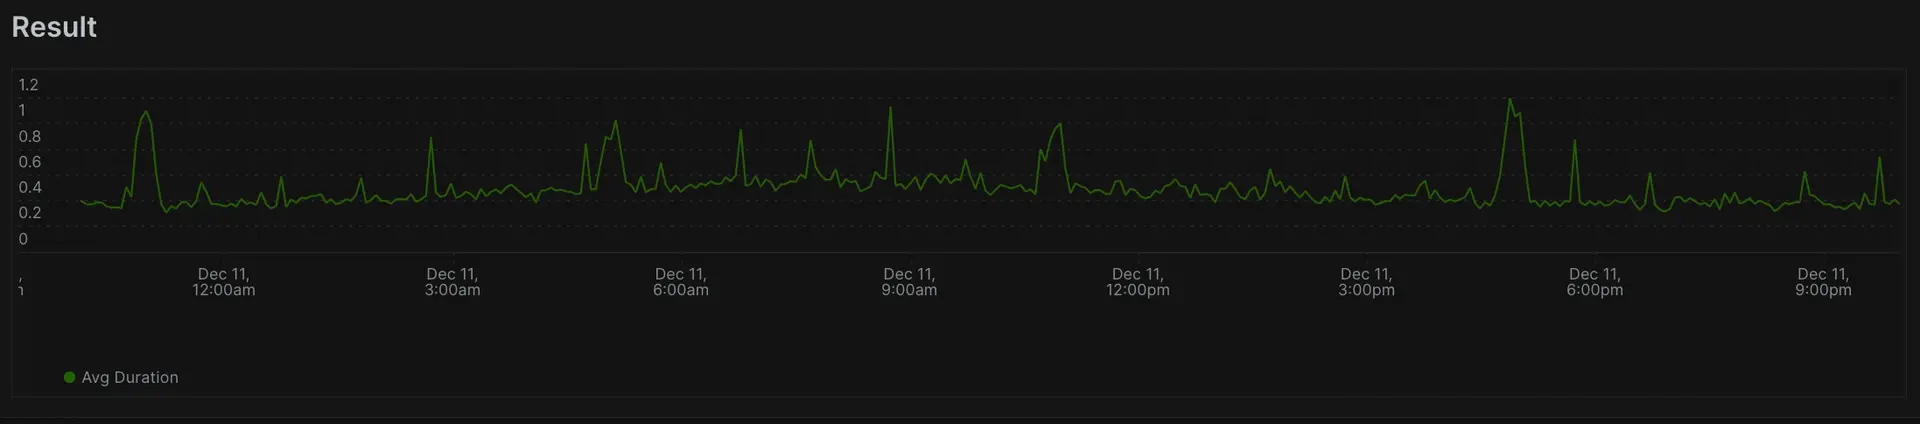 Now you've reached new levels of data visualization, breaking out from summarized numbers to line charts of data trends over time. As you can see, using `TIMESERIES` offers full control over visualizations, granularity, and averaging data over specified windows. It's time for the next step: using the `WHERE` clause.
````
### 5. Use the WHERE clause
1. Sometimes, you may want your query to operate on a specific subset of NRDB data. For example, when querying your application's average response time, you can use an attribute called `transactionType`, which specifies whether the transaction was a `Web` or `Non-Web` (such as a cron job or queued task) transaction. Use this example to create a query that only returns data for the `Web` transaction type:
````sql
SELECT average(duration)
FROM Transaction
WHERE transactionType='Web'
TIMESERIES
```
Now you've reached new levels of data visualization, breaking out from summarized numbers to line charts of data trends over time. As you can see, using `TIMESERIES` offers full control over visualizations, granularity, and averaging data over specified windows. It's time for the next step: using the `WHERE` clause.
````
### 5. Use the WHERE clause
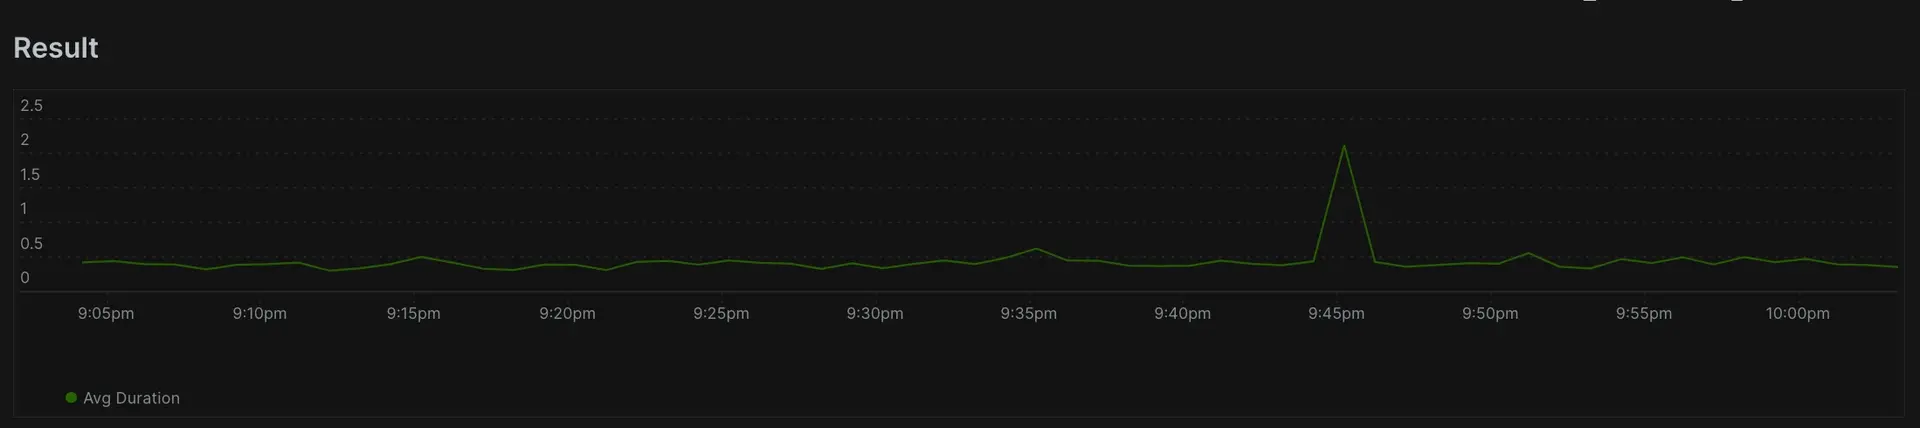
1. Sometimes, you may want your query to operate on a specific subset of NRDB data. For example, when querying your application's average response time, you can use an attribute called `transactionType`, which specifies whether the transaction was a `Web` or `Non-Web` (such as a cron job or queued task) transaction. Use this example to create a query that only returns data for the `Web` transaction type:
````sql
SELECT average(duration)
FROM Transaction
WHERE transactionType='Web'
TIMESERIES
```
 ````
2. You can also combine `AND` and `OR` to make more complex queries, using parentheses `(` and `)` to control how these work together. This query shows the average response time of "Web" transactions that were both faster than 100ms and had a response code of either 200 or 302. Notice the use of parentheses to control the `OR`.
````sql
SELECT average(duration)
FROM Transaction
WHERE transactionType='Web'
AND duration < 0.1
AND (httpResponseCode=200
OR httpResponseCode=302)
TIMESERIES
```
````
2. You can also combine `AND` and `OR` to make more complex queries, using parentheses `(` and `)` to control how these work together. This query shows the average response time of "Web" transactions that were both faster than 100ms and had a response code of either 200 or 302. Notice the use of parentheses to control the `OR`.
````sql
SELECT average(duration)
FROM Transaction
WHERE transactionType='Web'
AND duration < 0.1
AND (httpResponseCode=200
OR httpResponseCode=302)
TIMESERIES
```
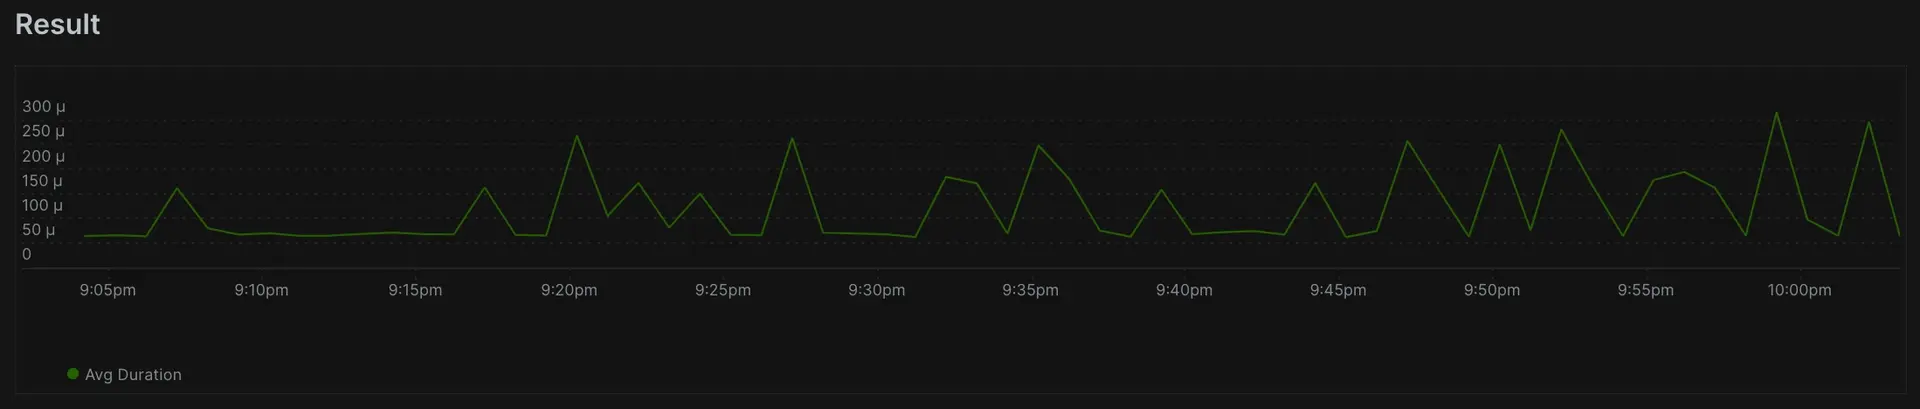 So far, every query you've made has performed actions on all available data in the given time window. But filtering out undesired data is also important. The examples above are useful to filter a type of transaction, or when a specific response code occurs. Similarly, you could filter to a specific `appName`, Transaction `name` or even a custom attribute you've tagged on your data. It's time for the final step in the tutorial: using faceted queries.
````
### 6. Facet your queries
1. Often, you'll want to determine the "Top N" values grouped by a specific attribute. In NRQL, you do this using `FACET`. For example, you can query the slowest `Transaction` calls observed on average, grouped by name. Think of this as "faceted by name".
````sql
SELECT average(duration)
FROM Transaction
FACET name
SINCE 1 day ago
```
````

2. By default, a faceted query returns the top 10 results, but you can customize how many results are returned by placing a `LIMIT`. In this example, use `TIMESERIES` to retrieve the top 5 results displayed on a line chart.
````sql
SELECT average(duration)
FROM Transaction
FACET name
SINCE 3 hours ago
LIMIT 5
TIMESERIES
```
````

3. But maybe you don't want a line chart, or you want a larger list of transactions. By removing `TIMESERIES`, you can render a bar or pie chart, and you can increase the scope of the list by increasing the `LIMIT`.
````sql
SELECT average(duration)
FROM Transaction
FACET name
SINCE 3 hours ago
LIMIT 20
```
````

4. Finally, here's a slightly more complex query that compares the quantity of Web transactions, broken down by individual applications that report to New Relic:
````sql
SELECT count(*)
FROM Transaction
WHERE transactionType='Web'
FACET appName
LIMIT 5
SINCE 6 hours ago
TIMESERIES
```
So far, every query you've made has performed actions on all available data in the given time window. But filtering out undesired data is also important. The examples above are useful to filter a type of transaction, or when a specific response code occurs. Similarly, you could filter to a specific `appName`, Transaction `name` or even a custom attribute you've tagged on your data. It's time for the final step in the tutorial: using faceted queries.
````
### 6. Facet your queries
1. Often, you'll want to determine the "Top N" values grouped by a specific attribute. In NRQL, you do this using `FACET`. For example, you can query the slowest `Transaction` calls observed on average, grouped by name. Think of this as "faceted by name".
````sql
SELECT average(duration)
FROM Transaction
FACET name
SINCE 1 day ago
```
````

2. By default, a faceted query returns the top 10 results, but you can customize how many results are returned by placing a `LIMIT`. In this example, use `TIMESERIES` to retrieve the top 5 results displayed on a line chart.
````sql
SELECT average(duration)
FROM Transaction
FACET name
SINCE 3 hours ago
LIMIT 5
TIMESERIES
```
````

3. But maybe you don't want a line chart, or you want a larger list of transactions. By removing `TIMESERIES`, you can render a bar or pie chart, and you can increase the scope of the list by increasing the `LIMIT`.
````sql
SELECT average(duration)
FROM Transaction
FACET name
SINCE 3 hours ago
LIMIT 20
```
````

4. Finally, here's a slightly more complex query that compares the quantity of Web transactions, broken down by individual applications that report to New Relic:
````sql
SELECT count(*)
FROM Transaction
WHERE transactionType='Web'
FACET appName
LIMIT 5
SINCE 6 hours ago
TIMESERIES
```
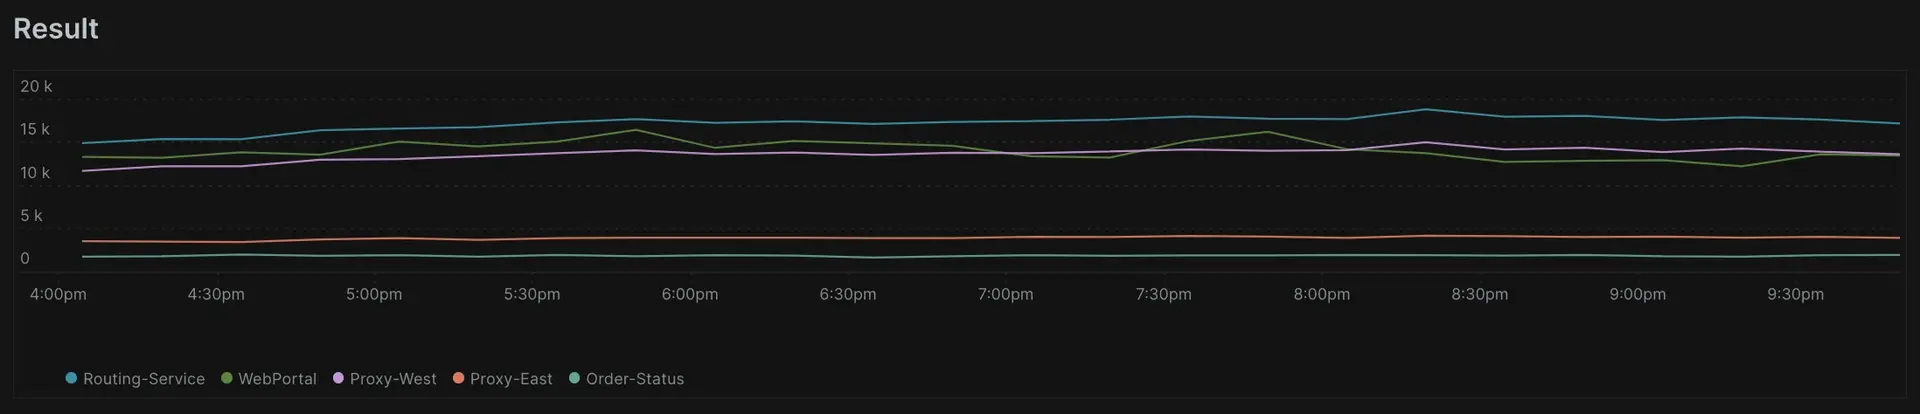 Grouping or "faceting" allows you to get dimensional with your data. When applying an aggregation function, you can use `FACET` to group by any attribute, default or custom, that reports event data (just like the `WHERE` clause). We recommend [adding custom attributes](/docs/data-apis/custom-data/custom-events/collect-custom-attributes/) to your data or [reporting new custom events](/docs/data-apis/custom-data/custom-events/apm-report-custom-events-attributes/) to allow you to more directly investigate the resulting data set.
````
Congratulations: you've completed the first NRQL tutorial! If you've made it this far, you now know the basics of querying event data using NRQL.
### What's next?
We have even more NRQL for you to explore with three more tutorials that cover more advanced concepts and use cases! We recommend proceeding to the tutorial on [processing your data](https://docs.newrelic.com/docs/query-your-data/nrql-new-relic-query-language/get-started/nrql-tutorial-process-your-data/) first, then moving on to the tutorial on [advancing your dashboarding](https://docs.newrelic.com/docs/query-your-data/nrql-new-relic-query-language/get-started/nrql-tutorial-advanced-dashboarding/), and finally finish the series with our tutorial on the most [advanced NRQL functions](https://docs.newrelic.com/docs/query-your-data/nrql-new-relic-query-language/get-started/nrql-tutorial-advanced-functions/).
Grouping or "faceting" allows you to get dimensional with your data. When applying an aggregation function, you can use `FACET` to group by any attribute, default or custom, that reports event data (just like the `WHERE` clause). We recommend [adding custom attributes](/docs/data-apis/custom-data/custom-events/collect-custom-attributes/) to your data or [reporting new custom events](/docs/data-apis/custom-data/custom-events/apm-report-custom-events-attributes/) to allow you to more directly investigate the resulting data set.
````
Congratulations: you've completed the first NRQL tutorial! If you've made it this far, you now know the basics of querying event data using NRQL.
### What's next?
We have even more NRQL for you to explore with three more tutorials that cover more advanced concepts and use cases! We recommend proceeding to the tutorial on [processing your data](https://docs.newrelic.com/docs/query-your-data/nrql-new-relic-query-language/get-started/nrql-tutorial-process-your-data/) first, then moving on to the tutorial on [advancing your dashboarding](https://docs.newrelic.com/docs/query-your-data/nrql-new-relic-query-language/get-started/nrql-tutorial-advanced-dashboarding/), and finally finish the series with our tutorial on the most [advanced NRQL functions](https://docs.newrelic.com/docs/query-your-data/nrql-new-relic-query-language/get-started/nrql-tutorial-advanced-functions/).