---
title: Build your own integration: New Relic Flex
source: https://docs.newrelic.com/docs/infrastructure/host-integrations/host-integrations-list/flex-integration-tool-build-your-own-integration
---
New Relic provides [integrations and quickstarts](https://newrelic.com/instant-observability) for many popular services and frameworks. If you're already using New Relic and want to report data from a service for which we don't have an integration, you can create your own integration by following these options:
- With infrastructure monitoring, you can use our lightweight Flex tool (recommended) or build a complete [on-host integration](https://docs.newrelic.com/docs/integrations/host-integrations/getting-started/introduction-host-integrations) using our [Integrations SDK](https://docs.newrelic.com/docs/integrations/integrations-sdk/getting-started/introduction-infrastructure-integrations-sdk).
- For telemetry (metrics, traces) monitoring solutions, use our [Telemetry SDKs](https://docs.newrelic.com/docs/data-ingest-apis/get-data-new-relic/new-relic-sdks/telemetry-sdks-send-custom-telemetry-data-new-relic).
- Build a custom [New Relic app](https://docs.newrelic.com/docs/new-relic-one/use-new-relic-one/build-new-relic-one/new-relic-one-build-your-own-custom-new-relic-one-application) that uses your own JavaScript UI functionality.
## What is New Relic Flex? [#what-is-it]
Flex is an application-agnostic, all-in-one New Relic integration that allows you to collect events and metrics from a wide range of services. It's bundled with our [infrastructure agent](https://docs.newrelic.com/docs/infrastructure/infrastructure-monitoring/get-started/get-started-infrastructure-monitoring/). You can instrument any application that exposes metrics over a standard protocol (HTTP, file, shell) in a standard format (for example, JSON or plain text): you create a YAML configuration file, start the infrastructure agent, and your data is reported to New Relic.
After collecting and cleaning up the data, you can then [query Flex data](https://docs.newrelic.com/docs/using-new-relic/data/understand-data/query-new-relic-data) in New Relic, create [custom charts](https://docs.newrelic.com/docs/query-your-data/explore-query-data/use-charts/use-your-charts/) for it, and use that data in your [dashboards](https://docs.newrelic.com/docs/query-your-data/explore-query-data/dashboards/introduction-dashboards/).
## Check the compatibility and requirements [#requirements]
Make sure your system meets these requirements:
1. [Sign up for a free account](https://newrelic.com/signup) if you haven't already. It's free!
2. See the [requirements for the infrastructure agent](https://docs.newrelic.com/docs/infrastructure/install-infrastructure-agent/get-started/requirements-infrastructure-agent/) document to make sure your system and any on-host integrations you configure meet the requirements.
3. Flex comes bundled with our [infrastructure agent](https://docs.newrelic.com/docs/infrastructure/infrastructure-monitoring/get-started/get-started-infrastructure-monitoring/) version 1.10.7 or higher running on Linux, Windows, or Kubernetes.
See the [identify outdated agent versions from the UI](https://docs.newrelic.com/docs/infrastructure/install-infrastructure-agent/update-or-uninstall/update-infrastructure-agent/#check-version) document to check your version or the [update the infrastructure agent](https://docs.newrelic.com/docs/infrastructure/install-infrastructure-agent/update-or-uninstall/update-infrastructure-agent/) document if you need to update it.
## Installation [#installation]
Follow these steps to install New Relic Flex:
### Install the infrastructure agent [#install-infra-agent]
Starting from New Relic infrastructure agent version 1.10.7, Flex comes bundled with the agent. To install the infrastructure agent, see:
- [Install the infrastructure agent for Linux](https://docs.newrelic.com/docs/infrastructure/install-infrastructure-agent/linux-installation/install-infrastructure-monitoring-agent-linux/)
- [Install the infrastructure agent for Windows](https://docs.newrelic.com/docs/infrastructure/install-infrastructure-agent/windows-installation/install-infrastructure-monitoring-agent-windows/)
> #### 💡 TIP
>
> The agent must run in the [root/administrator](https://docs.newrelic.com/docs/infrastructure/install-infrastructure-agent/linux-installation/linux-agent-running-modes/) mode. You can [start, stop, and restart](https://docs.newrelic.com/docs/infrastructure/install-infrastructure-agent/manage-your-agent/start-stop-restart-infrastructure-agent/) the infrastructure agent from the command line.
### Check that Flex is up and running [#flex-up-running]
Follow these steps:
1. Navigate to the integrations folder of the Infrastructure agent:
- For Linux: `/etc/newrelic-infra/integrations.d`
- For Windows: `C:\Program Files\New Relic\newrelic-infra\integrations.d\`
2. Create the integration configuration file. For example, `integrations.yml`, if it doesn't exist.
3. Add the Flex configuration to the file:
```yaml
integrations:
- name: nri-flex
config:
name: just-testing
```
If you already have an `integrations` section in the file, add `nri-flex` to it.
4. After a few minutes, go to **[one.newrelic.com > All capabilities](https://one.newrelic.com/all-capabilities) > Query your data** and run this query:
```sql
FROM flexStatusSample
SELECT *
LIMIT 1
```
The query should give a table similar to this:
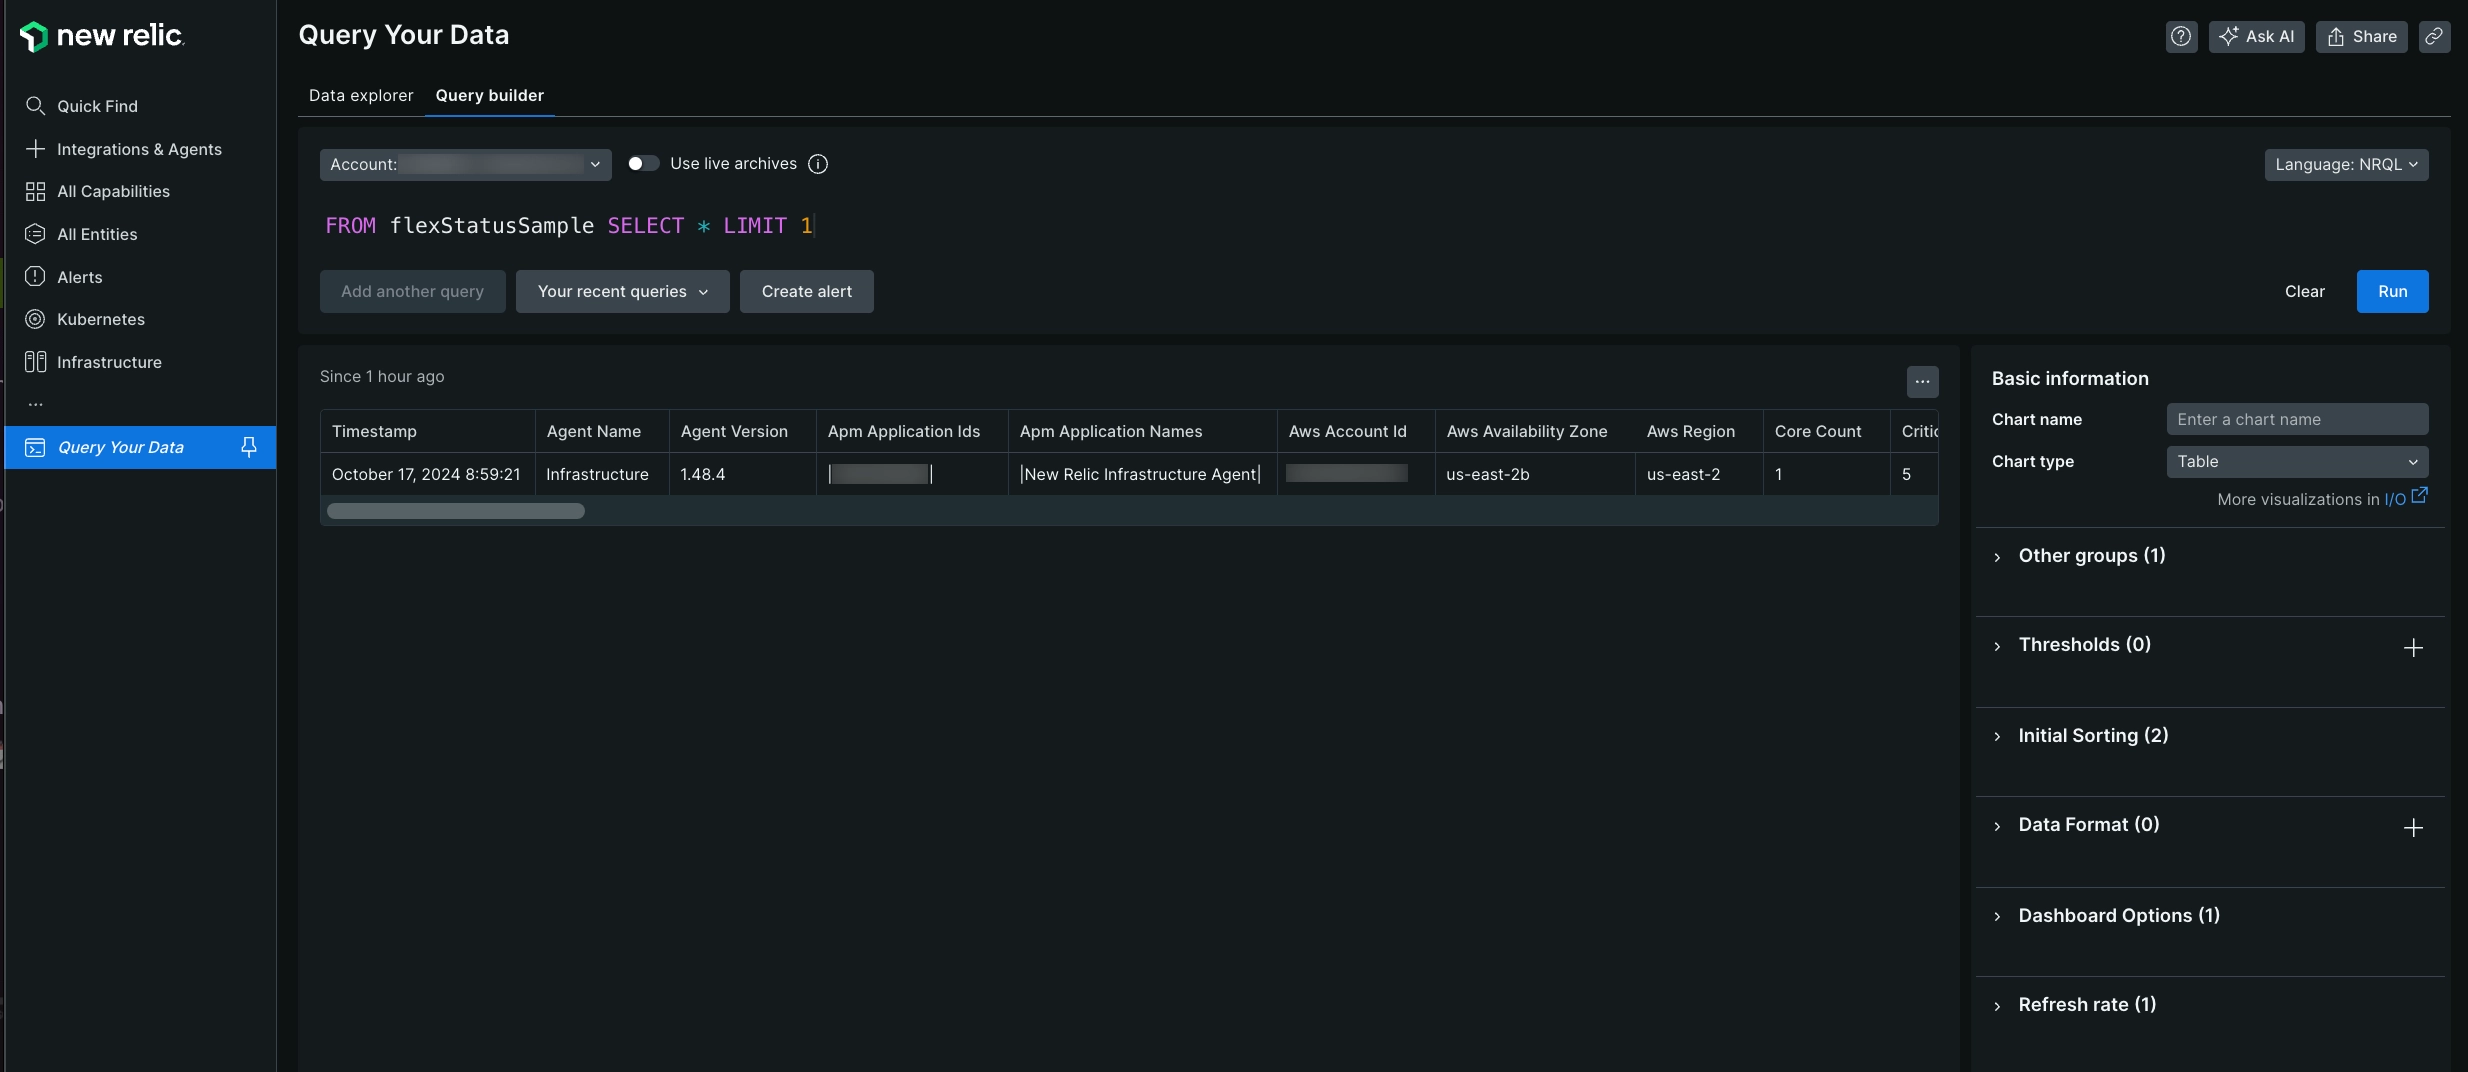
Go to **[one.newrelic.com > All capabilities](https://one.newrelic.com/all-capabilities) > Query your data**, add your query in the query builder, and click **Run**.
> #### 💡 TIP
>
> If you don't get anything, make sure that your YAML configuration file is well indented and that indentation levels don't use tabs instead of spaces. You can use a YAML validator, such as [YAML Lint](https://www.yamllint.com/)
### Your first Flex integration [#first-flex-integration]
This example shows how to collect disk metrics from file systems not natively supported by New Relic using the `df` command in Linux.
The goal is to process the output of the `df` command, showing the file system and 1-byte blocks, while excluding file systems already supported by the agent. If unsupported file systems are not mounted, remove the `-x` arguments.
````bash
df -PT -B1 -x tmpfs -x xfs -x vxfs -x btrfs -x ext -x ext2 -x ext3 -x ext4
[output] Filesystem Type 1-blocks Used Available Capacity Mounted on
[output] devtmpfs devtmpfs 246296576 0 246296576 0% /dev
[output] go_src vboxsf 499963170816 361339486208 138623684608 73% /go/src
```
You need to convert the above tabular text output into a set of equivalent JSON samples with the following format. Notice that the agent decorates each sample with extra fields:
```json
{
"event": {
"event_type": "FileSystemSample",
"fs": "go_src",
"fsType": "vboxsf",
"capacityBytes": 499963170816,
"usedBytes": 361345331200,
"availableBytes": 138617839616,
"usedPerc": 73,
"mountedOn": "/go/src"
}
}
```
First, you need to tell Flex how to perform the above table text to JSON transformation by specifying the following:
* Name of the metric: `FileSystem`
* Which command to run: `df -PT -B1 ...`
* How to split the output table from `df`
* How to assign the values to given metric names
This is achieved by placing the content below in the YAML configuration file:
```yaml
integrations:
- name: nri-flex
config:
name: linuxFileSystemIntegration
apis:
- name: FileSystem
commands:
- run: 'df -PT -B1 -x tmpfs -x xfs -x vxfs -x btrfs -x ext -x ext2 -x ext3 -x ext4'
split: horizontal
split_by: \s+
row_start: 1
set_header: [fs,fsType,capacityBytes,usedBytes,availableBytes,usedPerc,mountedOn]
perc_to_decimal: true
```
* `apis` is an array of entries for each sample. Each entry sets a name for the sample, as well as the commands and procedures to get and process the sample. The first entry in the example is named `FileSystem`, which is used to name the `FileSystemSample` event.
* `commands` specifies how to get the information from CLI applications:
* `run: 'df -PT -B1...` specifies the command to run.
* `split: horizontal` states that each output line may return a metric.
* `split_by` explains how to split each line in different fields. In this case, we use the `\s+` regular expression, which tells Flex that any sequence of one or more white spaces is a separator.
* `row_start` specifies that data starts right after the first row (which is 0).
* `set_header` specifies, in order, a matching name for each value of the aforementioned array.
* `perc_to_decimal: true` indicates to convert any percentage string into a decimal value, removing the trailing `%` symbol.
Once you've created the Flex configuration, the infrastructure agent autodetects the new configuration and begins collecting data. To check that your new integration is working, run this query:
```sql
FROM FileSystemSample
SELECT mountedOn, fs, usedBytes, capacityBytes, usedBytes
```
The query should give a table similar to this:
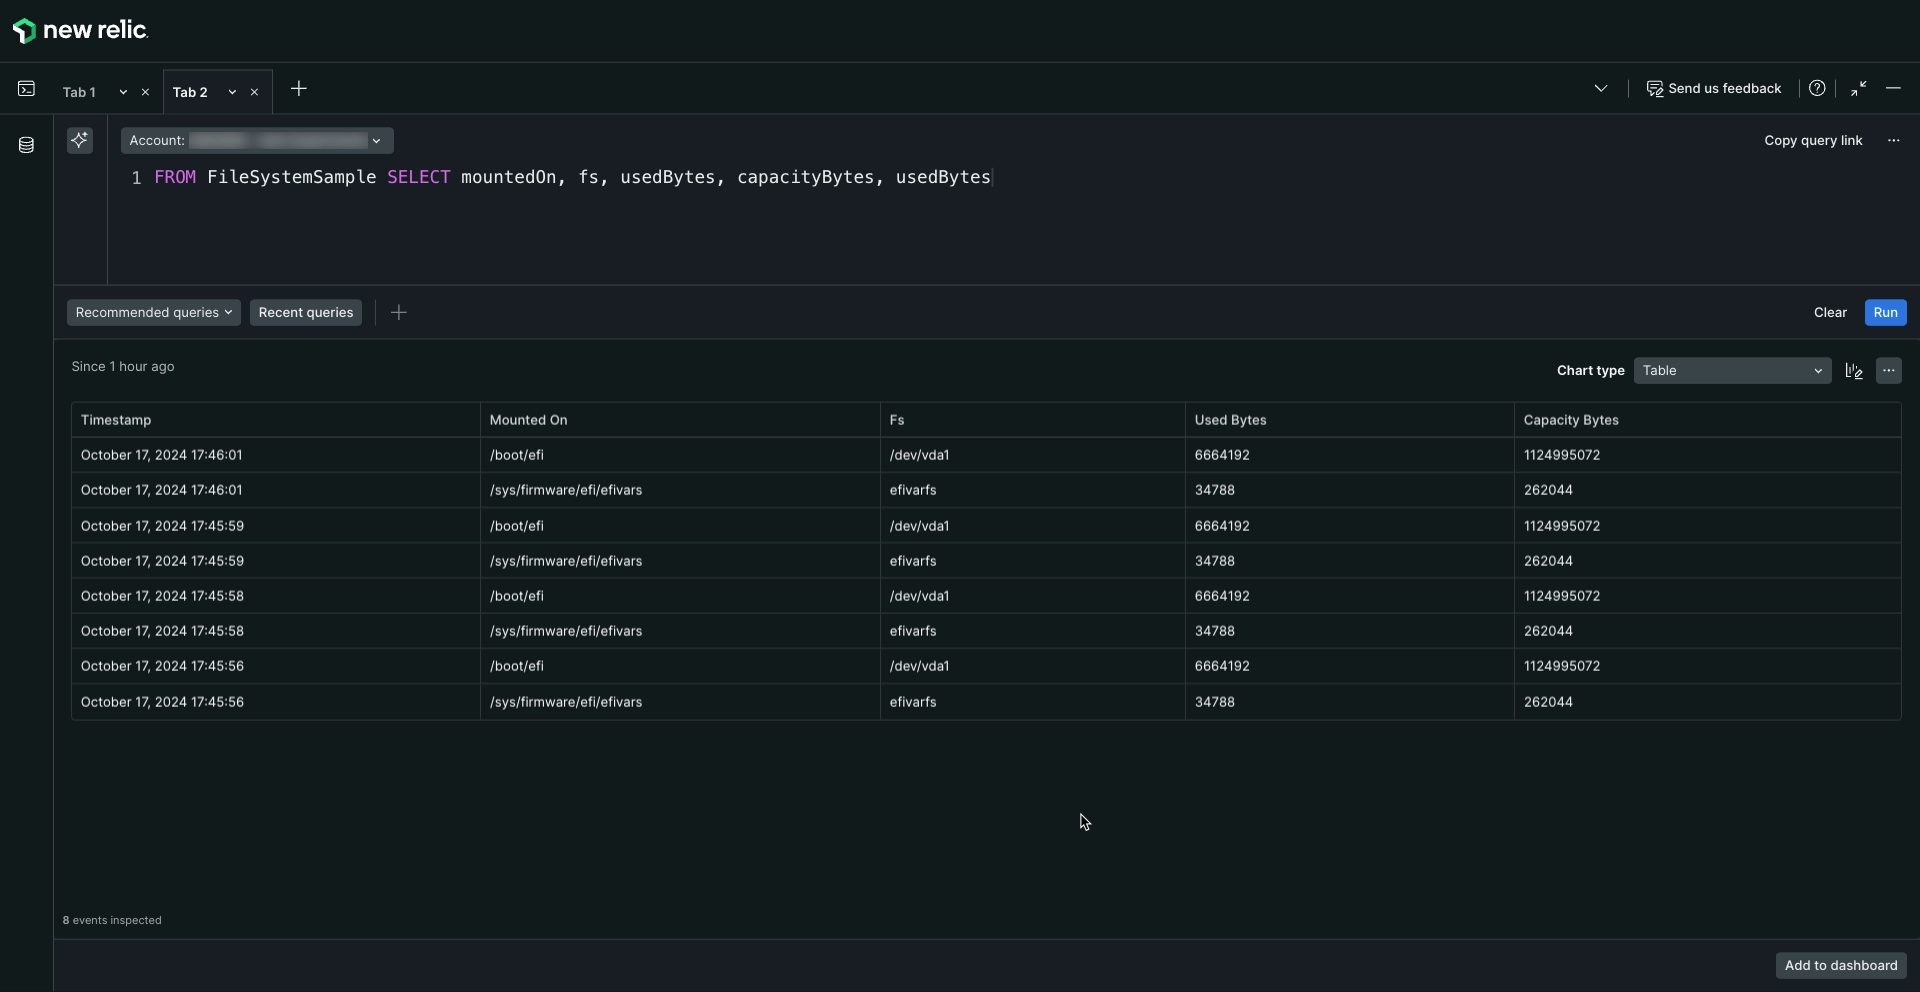 Go to **[one.newrelic.com > All capabilities](https://one.newrelic.com/all-capabilities) > Query your data**, add your query in the query builder, and click **Run**.
````
## How to add more Flex integrations [#add-more-integrations]
You can add more Flex integrations by adding the configuration in the `ìntegrations.d` file. Stand-alone Flex configurations start with the name of the integration and you can test them by invoking Flex from the command line:
```bash
sudo /var/db/newrelic-infra/newrelic-integrations/bin/nri-flex --verbose --pretty --config_file ./myconfig.yml
```
For example, if you want to add this integration:
```yaml
name: linuxOpenFD
apis:
- name: linuxOpenFD
commands:
- run: cat /proc/sys/fs/file-nr | awk '{print $1-$2,$3}'
split: horizontal
set_header: [openFD,maxFD]
regex_match: true
split_by: (\d+)\s+(.*)
```
You should open the `ìntegrations.d` file and add it like this:
```yaml
integrations:
- name: nri-flex
config:
name: linuxFileSystemIntegration
apis:
- name: FileSystem
commands:
- run: 'df -PT -B1 -x tmpfs -x xfs -x vxfs -x btrfs -x ext -x ext2 -x ext3 -x ext4'
split: horizontal
split_by: \s+
row_start: 1
set_header: [fs,fsType,capacityBytes,usedBytes,availableBytes,usedPerc,mountedOn]
perc_to_decimal: true
- name: linuxOpenFD
commands:
- run: cat /proc/sys/fs/file-nr | awk '{print $1-$2,$3}'
split: horizontal
set_header: [openFD,maxFD]
regex_match: true
split_by: (\d+)\s+(.*)
```
If you need to add multiple Flex configuration to the `ìntegrations.d` file, follow this pattern:
```yaml
integrations:
- name: nri-flex
config:
name: flexName_1
# Flex config goes here
- name: nri-flex
config:
name: flexName_2
# Flex config goes here
- name: nri-flex
config:
name: flexName_3
# Flex config goes here
```
To minimize indentation issues, you can link to stand-alone Flex configuration files using the `config_template_path` directive:
```yaml
integrations:
- name: nri-flex
config_template_path: /path/to/flex/integration.yml
```
You can find a lot of examples of custom integrations in the [Flex repository](https://github.com/newrelic/nri-flex/blob/master/examples).
## Flex and Kubernetes [#flex-k8s]
There are 3 container images you can use, depending on how you want to configure Flex in Kubernetes:
- To run Flex only to monitor services running in Kubernetes, use the `newrelic/infrastructure` container image. This image only contains the infrastructure agent, and the Docker and Flex integrations. With this option, you will can't perform service discovery or use other New Relic integrations.
- To run Flex alongside other New Relic integrations, use the `newrelic/infrastructure-bundle` container image. This adds all the other New Relic integrations.
- If you also want to monitor your Kubernetes cluster, use the `newrelic/infrastructure-k8s` container image. This image adds all the integrations, including the Kubernetes integration.
> #### ⚠️ IMPORTANT
>
> If you're running services in Kubernetes, we recommend you use the official container images from New Relic. See [Introduction to the Kubernetes integration](https://docs.newrelic.com/docs/kubernetes-pixie/kubernetes-integration/get-started/introduction-kubernetes-integration/) for more information.
### Configure Flex in Kubernetes [#configure-flex-k8s]
After installing the [Kubernetes integration](/install/kubernetes/), you'll have the infrastructure agent running in your cluster as well as these 2 `configMap`:
- `nri-default-integration-cfg`: This is a `configMap` used to enable the New Relic Kubernetes integration. You can remove it if you don't to use this integration. If you've installed Kubernetes with the [Helm command](/install/kubernetes/?dropdown1=helm), the value `integrations_config` needs to be populated. See the [New Relic's Helm charts repository](https://github.com/newrelic/helm-charts) for more information.
- `nri-integration-cfg-example`: This is a `configMap` used to enable Flex and other New Relic integration.
To enable Flex, create a data section in the `configMap`, and add the infrastructure agent integration configuration under this new section:
```yaml
apiVersion: v1
kind: ConfigMap
metadata:
name: nri-integration-cfg-example
namespace: default
data:
nri-flex.yml: |
integrations:
- name: nri-flex
config:
name: example
apis:
- event_type: ExampleSample
url: https://my-host:8443/admin/metrics.json
```
## Sample configurations [#sample-configurations]
Looking for different samples? Here are some example configurations to help you start with various data sources:
- **Databases**:
- [MySQL](https://github.com/newrelic/nri-flex/blob/master/examples/mysql-database-example.yml)
- [Oracle](https://github.com/newrelic/nri-flex/blob/master/examples/oracle-database-example.yml)
- [Postgres](https://github.com/newrelic/nri-flex/blob/master/examples/postgres-db-example.yml)
- **Third-party APIs**:
- [JSON API](https://github.com/newrelic/nri-flex/blob/master/examples/http-json-example.yml)
- [Twilio](https://github.com/newrelic/nri-flex/blob/master/examples/twilio-status.yml) health status
- **Command line utilities**:
- [AWS CLI](https://github.com/newrelic/nri-flex/blob/master/examples/aws-cli-example.yml)
- [Linux](https://github.com/newrelic/nri-flex/blob/master/examples/linux/linux-memory.yml)
- [Windows PowerShell](https://github.com/newrelic/nri-flex/blob/master/examples/windows/windows-iis-app-pool-status.yml)
## Troubleshooting [#troubleshooting]
If you encounter an issue with the Flex configuration, you can follow these basic troubleshooting steps:
- Test the configuration without the infrastructure agent: You can manually test a configuration file to ensure the output meets your expectations by running a command like this. Remember to replace `` with the name of your config file:
```shell
# Linux default path: /opt/newrelic-infra/newrelic-integrations/bin/
./nri-flex -verbose -pretty -config_path /etc/newrelic-infra/integrations.d/
# Windows default path: C:\Program Files\New Relic\newrelic-infra\newrelic-integrations
.\nri-flex.exe -verbose -pretty -config_path "C:\Program Files\New Relic\newrelic-infra\integrations.d\"
```
This will give you an output showing debug logging and JSON payload that will be integrated with the infrastucture agent. Make sure Flex is obtaining and formatting your telemetry as expected before continue with the rest of the troubleshooting steps. Learn more about testing Flex configurations from the [GitHub repository](https://github.com/newrelic/nri-flex/blob/master/docs/troubleshooting.md#testing-a-config).
- Test with the infrastructure agent in `dry-run` mode: Use the [`dry-run` flag](https://docs.newrelic.com/docs/infrastructure/host-integrations/troubleshooting/run-integrations-manually/) in the infrastructure agent to test your Flex configuration. Verify the output contains the telemetry you expect to report to New Relic.
- Debug the integration with the infrastructure agent: Ensure the agent is reporting the telemetry data as expected by [enabling debug logs](https://docs.newrelic.com/docs/infrastructure/infrastructure-troubleshooting/troubleshoot-logs/generate-logs-troubleshooting-infrastructure/) in the infrastructure agent.
> #### 💡 TIP
>
> You can fetch the standalone binary from [here](https://github.com/newrelic/nri-flex/releases). See the [README](https://github.com/newrelic/nri-flex?tab=readme-ov-file#new-relic-flex) file to know more about Flex
Go to **[one.newrelic.com > All capabilities](https://one.newrelic.com/all-capabilities) > Query your data**, add your query in the query builder, and click **Run**.
````
## How to add more Flex integrations [#add-more-integrations]
You can add more Flex integrations by adding the configuration in the `ìntegrations.d` file. Stand-alone Flex configurations start with the name of the integration and you can test them by invoking Flex from the command line:
```bash
sudo /var/db/newrelic-infra/newrelic-integrations/bin/nri-flex --verbose --pretty --config_file ./myconfig.yml
```
For example, if you want to add this integration:
```yaml
name: linuxOpenFD
apis:
- name: linuxOpenFD
commands:
- run: cat /proc/sys/fs/file-nr | awk '{print $1-$2,$3}'
split: horizontal
set_header: [openFD,maxFD]
regex_match: true
split_by: (\d+)\s+(.*)
```
You should open the `ìntegrations.d` file and add it like this:
```yaml
integrations:
- name: nri-flex
config:
name: linuxFileSystemIntegration
apis:
- name: FileSystem
commands:
- run: 'df -PT -B1 -x tmpfs -x xfs -x vxfs -x btrfs -x ext -x ext2 -x ext3 -x ext4'
split: horizontal
split_by: \s+
row_start: 1
set_header: [fs,fsType,capacityBytes,usedBytes,availableBytes,usedPerc,mountedOn]
perc_to_decimal: true
- name: linuxOpenFD
commands:
- run: cat /proc/sys/fs/file-nr | awk '{print $1-$2,$3}'
split: horizontal
set_header: [openFD,maxFD]
regex_match: true
split_by: (\d+)\s+(.*)
```
If you need to add multiple Flex configuration to the `ìntegrations.d` file, follow this pattern:
```yaml
integrations:
- name: nri-flex
config:
name: flexName_1
# Flex config goes here
- name: nri-flex
config:
name: flexName_2
# Flex config goes here
- name: nri-flex
config:
name: flexName_3
# Flex config goes here
```
To minimize indentation issues, you can link to stand-alone Flex configuration files using the `config_template_path` directive:
```yaml
integrations:
- name: nri-flex
config_template_path: /path/to/flex/integration.yml
```
You can find a lot of examples of custom integrations in the [Flex repository](https://github.com/newrelic/nri-flex/blob/master/examples).
## Flex and Kubernetes [#flex-k8s]
There are 3 container images you can use, depending on how you want to configure Flex in Kubernetes:
- To run Flex only to monitor services running in Kubernetes, use the `newrelic/infrastructure` container image. This image only contains the infrastructure agent, and the Docker and Flex integrations. With this option, you will can't perform service discovery or use other New Relic integrations.
- To run Flex alongside other New Relic integrations, use the `newrelic/infrastructure-bundle` container image. This adds all the other New Relic integrations.
- If you also want to monitor your Kubernetes cluster, use the `newrelic/infrastructure-k8s` container image. This image adds all the integrations, including the Kubernetes integration.
> #### ⚠️ IMPORTANT
>
> If you're running services in Kubernetes, we recommend you use the official container images from New Relic. See [Introduction to the Kubernetes integration](https://docs.newrelic.com/docs/kubernetes-pixie/kubernetes-integration/get-started/introduction-kubernetes-integration/) for more information.
### Configure Flex in Kubernetes [#configure-flex-k8s]
After installing the [Kubernetes integration](/install/kubernetes/), you'll have the infrastructure agent running in your cluster as well as these 2 `configMap`:
- `nri-default-integration-cfg`: This is a `configMap` used to enable the New Relic Kubernetes integration. You can remove it if you don't to use this integration. If you've installed Kubernetes with the [Helm command](/install/kubernetes/?dropdown1=helm), the value `integrations_config` needs to be populated. See the [New Relic's Helm charts repository](https://github.com/newrelic/helm-charts) for more information.
- `nri-integration-cfg-example`: This is a `configMap` used to enable Flex and other New Relic integration.
To enable Flex, create a data section in the `configMap`, and add the infrastructure agent integration configuration under this new section:
```yaml
apiVersion: v1
kind: ConfigMap
metadata:
name: nri-integration-cfg-example
namespace: default
data:
nri-flex.yml: |
integrations:
- name: nri-flex
config:
name: example
apis:
- event_type: ExampleSample
url: https://my-host:8443/admin/metrics.json
```
## Sample configurations [#sample-configurations]
Looking for different samples? Here are some example configurations to help you start with various data sources:
- **Databases**:
- [MySQL](https://github.com/newrelic/nri-flex/blob/master/examples/mysql-database-example.yml)
- [Oracle](https://github.com/newrelic/nri-flex/blob/master/examples/oracle-database-example.yml)
- [Postgres](https://github.com/newrelic/nri-flex/blob/master/examples/postgres-db-example.yml)
- **Third-party APIs**:
- [JSON API](https://github.com/newrelic/nri-flex/blob/master/examples/http-json-example.yml)
- [Twilio](https://github.com/newrelic/nri-flex/blob/master/examples/twilio-status.yml) health status
- **Command line utilities**:
- [AWS CLI](https://github.com/newrelic/nri-flex/blob/master/examples/aws-cli-example.yml)
- [Linux](https://github.com/newrelic/nri-flex/blob/master/examples/linux/linux-memory.yml)
- [Windows PowerShell](https://github.com/newrelic/nri-flex/blob/master/examples/windows/windows-iis-app-pool-status.yml)
## Troubleshooting [#troubleshooting]
If you encounter an issue with the Flex configuration, you can follow these basic troubleshooting steps:
- Test the configuration without the infrastructure agent: You can manually test a configuration file to ensure the output meets your expectations by running a command like this. Remember to replace `` with the name of your config file:
```shell
# Linux default path: /opt/newrelic-infra/newrelic-integrations/bin/
./nri-flex -verbose -pretty -config_path /etc/newrelic-infra/integrations.d/
# Windows default path: C:\Program Files\New Relic\newrelic-infra\newrelic-integrations
.\nri-flex.exe -verbose -pretty -config_path "C:\Program Files\New Relic\newrelic-infra\integrations.d\"
```
This will give you an output showing debug logging and JSON payload that will be integrated with the infrastucture agent. Make sure Flex is obtaining and formatting your telemetry as expected before continue with the rest of the troubleshooting steps. Learn more about testing Flex configurations from the [GitHub repository](https://github.com/newrelic/nri-flex/blob/master/docs/troubleshooting.md#testing-a-config).
- Test with the infrastructure agent in `dry-run` mode: Use the [`dry-run` flag](https://docs.newrelic.com/docs/infrastructure/host-integrations/troubleshooting/run-integrations-manually/) in the infrastructure agent to test your Flex configuration. Verify the output contains the telemetry you expect to report to New Relic.
- Debug the integration with the infrastructure agent: Ensure the agent is reporting the telemetry data as expected by [enabling debug logs](https://docs.newrelic.com/docs/infrastructure/infrastructure-troubleshooting/troubleshoot-logs/generate-logs-troubleshooting-infrastructure/) in the infrastructure agent.
> #### 💡 TIP
>
> You can fetch the standalone binary from [here](https://github.com/newrelic/nri-flex/releases). See the [README](https://github.com/newrelic/nri-flex?tab=readme-ov-file#new-relic-flex) file to know more about Flex