---
title: Lab part 2: Instrument your application
source: https://docs.newrelic.com/docs/browser/new-relic-browser/lab/install-browser-agent
---
> #### 💡 LAB
>
> This procedure is part of a lab that teaches you how to troubleshoot your web app with New Relic browser monitoring.
>
> Each procedure in the lab builds upon the last, so make sure you've completed the last procedure, [Set up your lab environment](https://docs.newrelic.com/docs/browser/new-relic-browser/lab/set-up-env/), before starting this one.
Your React app is now up and running in the browser. You want to make sure your users always have the best experience on your site. For that, you need insights into your users' experiences, such as their page load times.
To achieve this goal, you need to install our browser agent.
## Install browser agent
1. Navigate to [New Relic](https://one.newrelic.com/), and sign in with your account.
2. On the right side of the upper navigation bar, click **Integrations & Agents**.
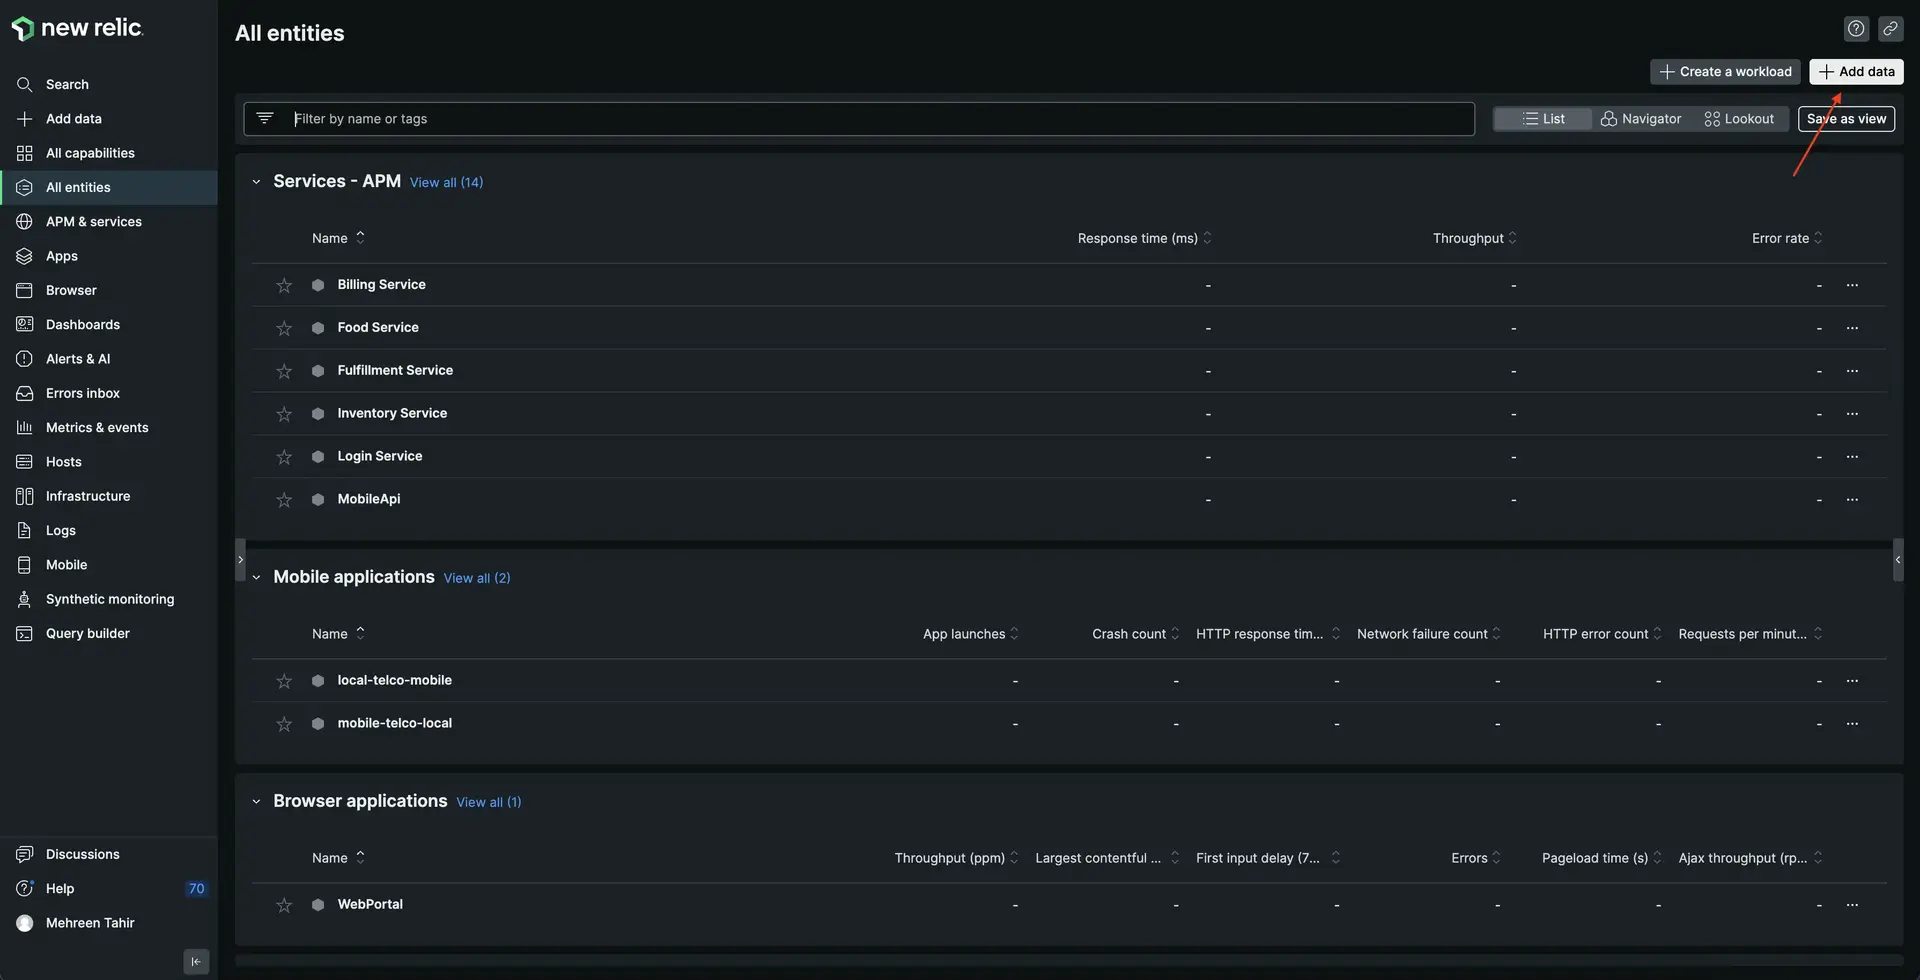
3. Scroll down to **Browser & mobile** and select **Browser monitoring**.
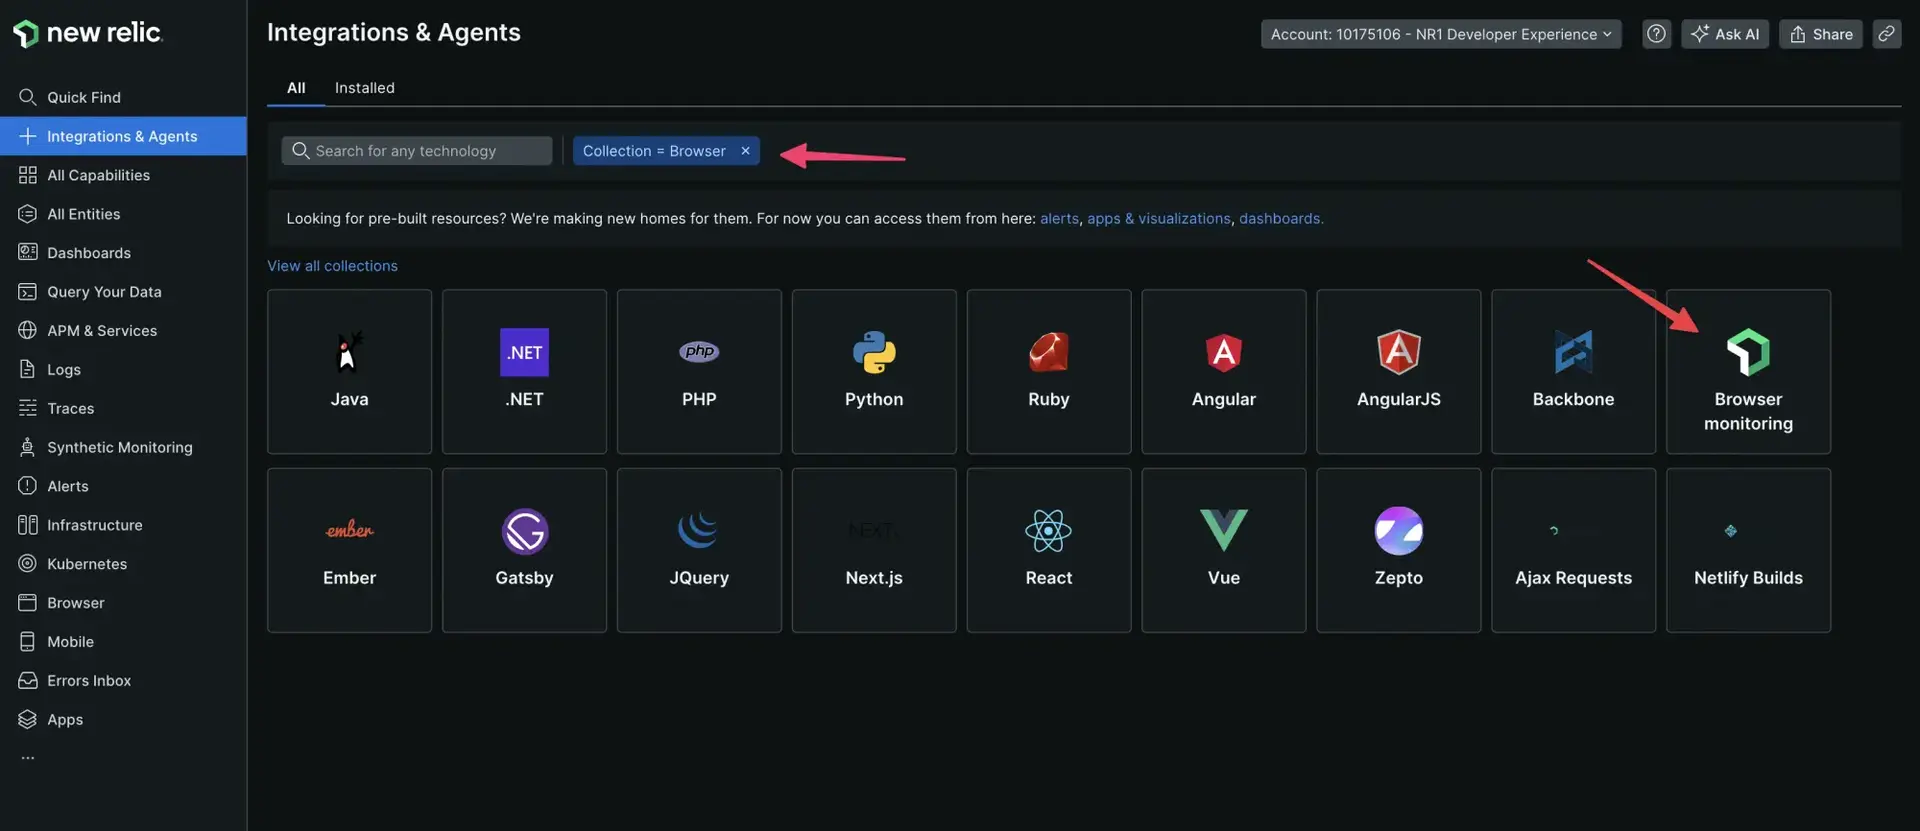
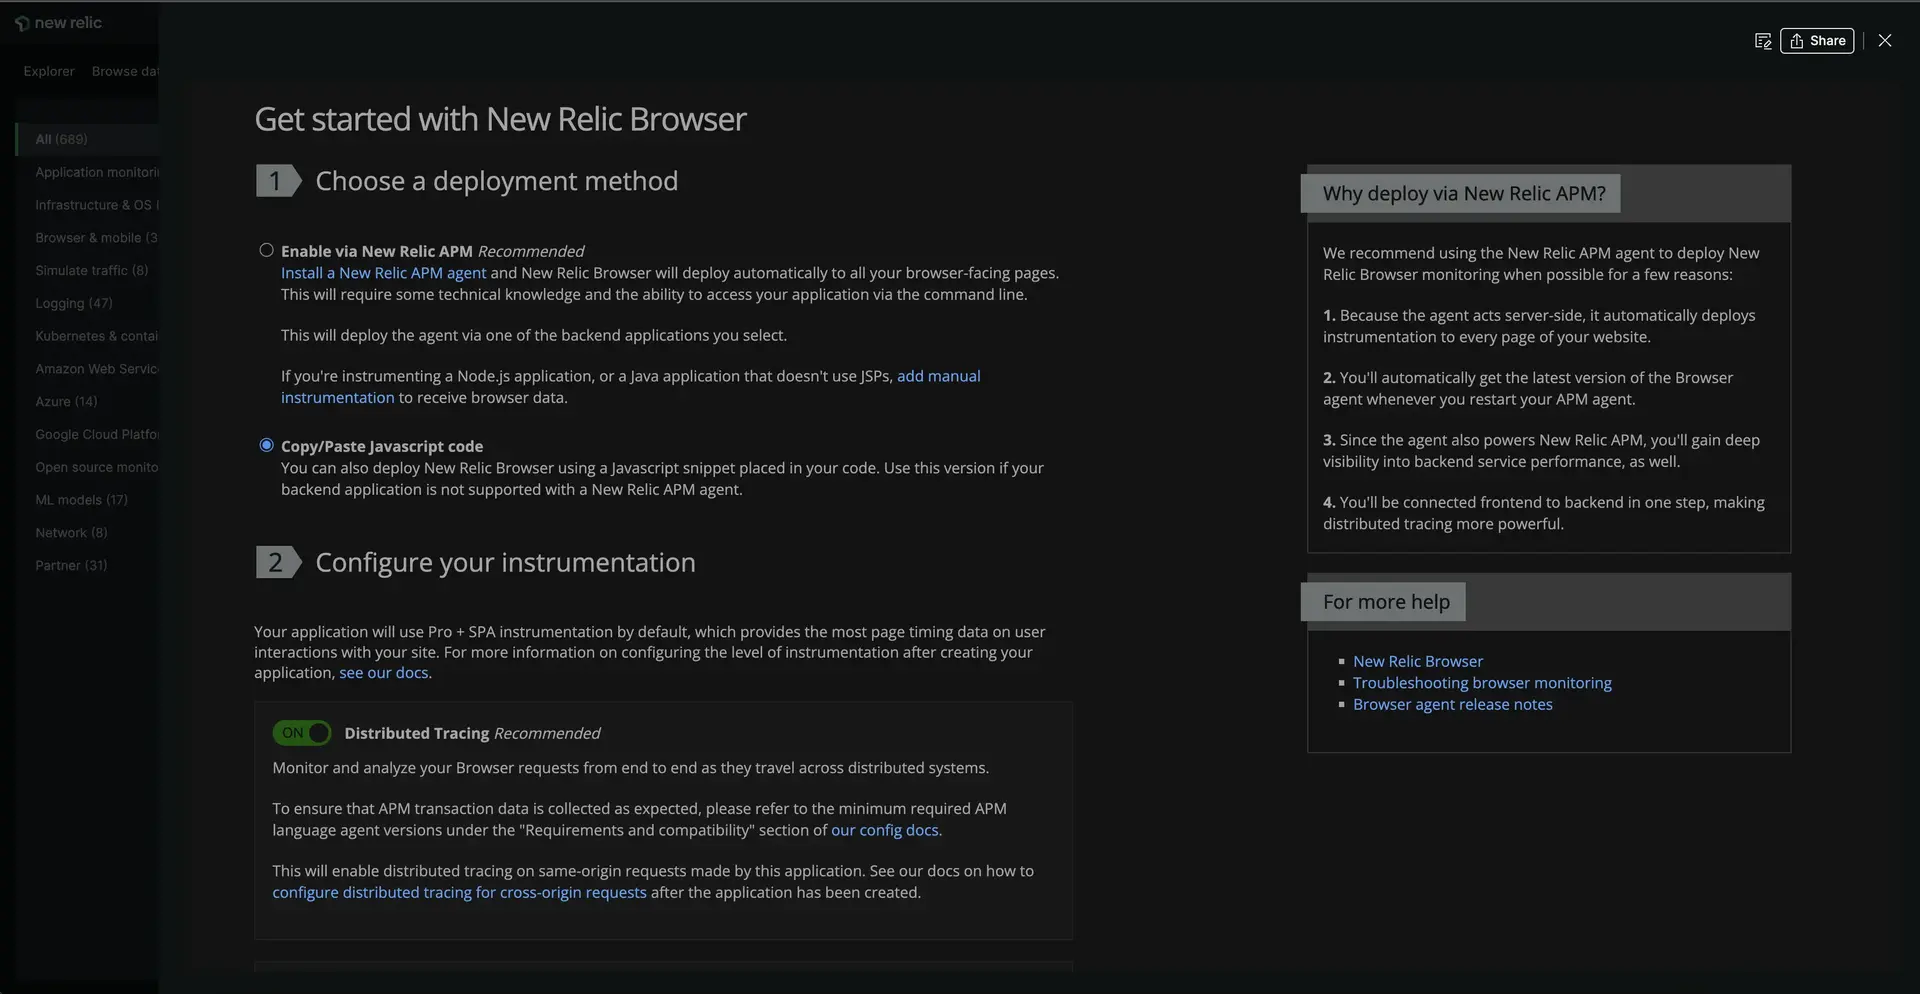
The UI will guide you through installing our browser agent.
4. Select **Copy/paste JavaScript code** for your deployment method.
5. Scroll down to **Name your app**. Name your app **Relicstaurants**, and click **Enable**.
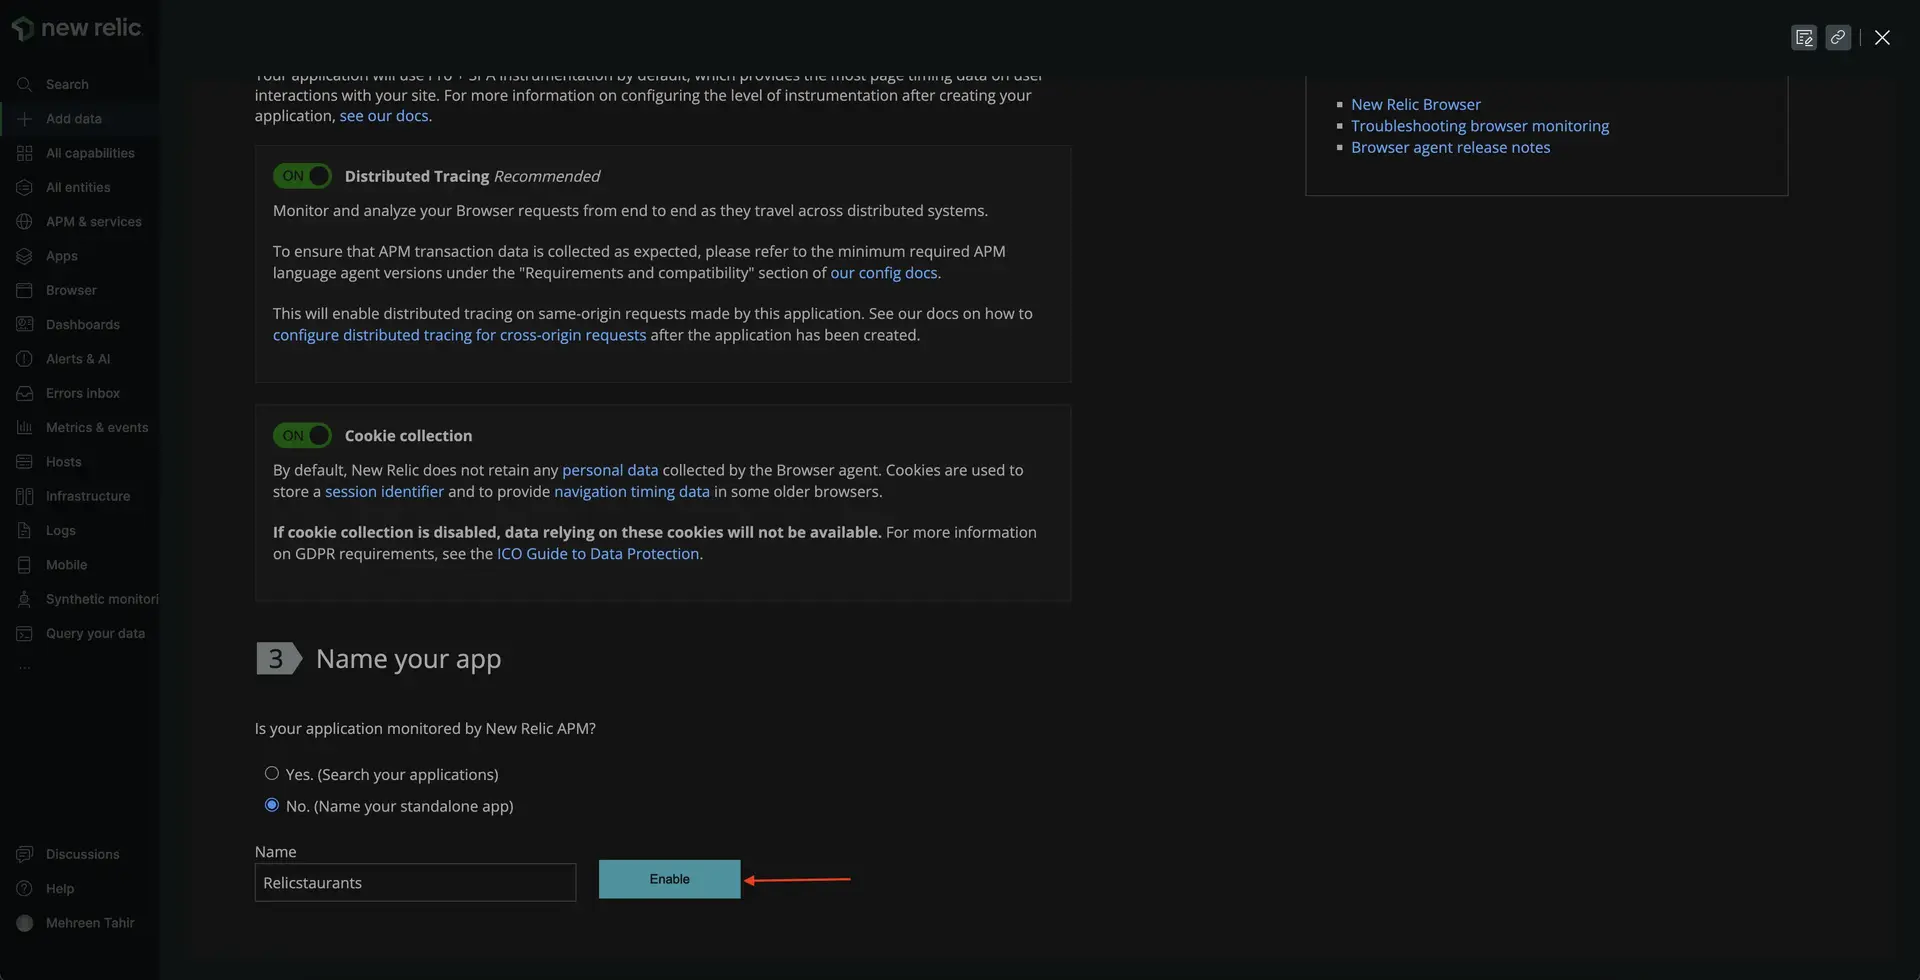
This gives you a JavaScript code snippet to enable browser monitoring. Copy it to your clipboard.
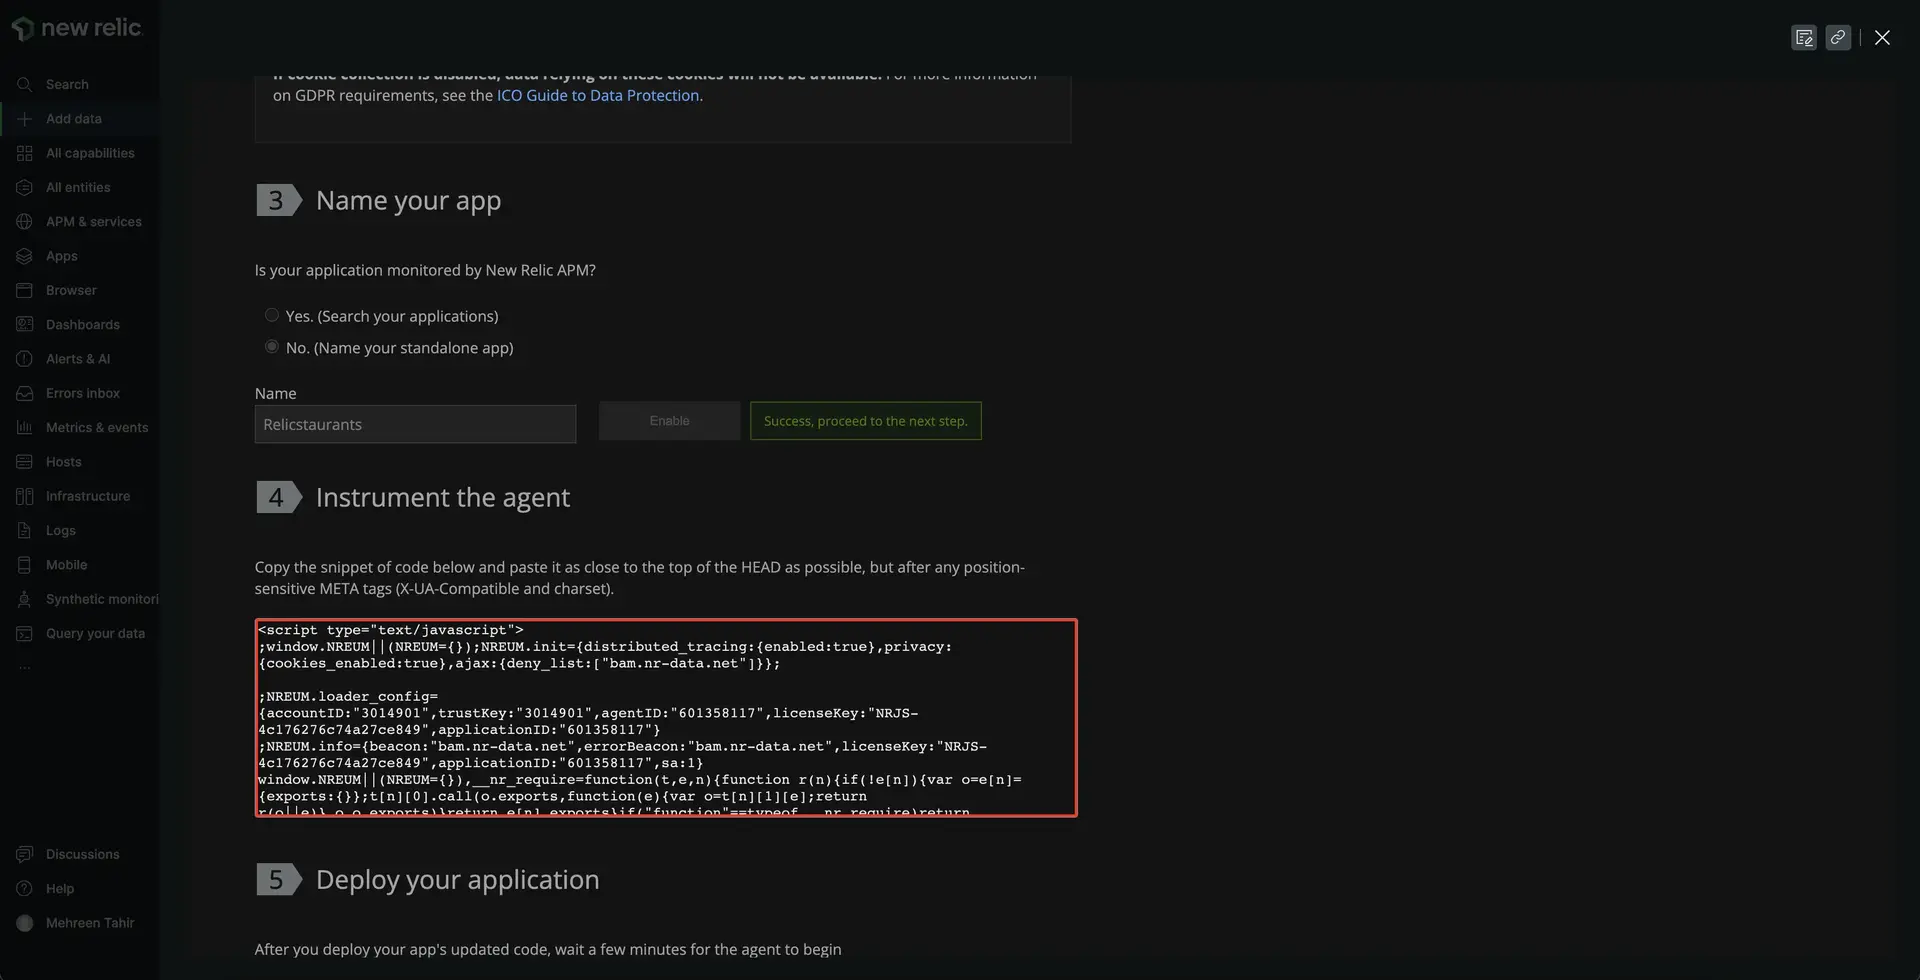
6. Open your app in the IDE of your choice.
In _public/index.html_ file of your app, paste the copied JavaScript snippet inside the ``.
````html lineHighlight=22-23 fileName=public/index.html
Relicstaurants
```
Your application is now instrumented with our browser agent.
````
## Restart your application
Now that you've instrumented your application, it's time to restart your local server.
```bash
npm run build
npm run newstart
```
Restart your load generator, as well.
```bash
python3 simulator.py
```
> #### ⚠️ IMPORTANT
>
> Make sure you're running these commands in the correct terminal windows. If you no longer have those windows, follow the steps in the [setup procedure](https://docs.newrelic.com/docs/browser/new-relic-browser/lab/set-up-env).
## View your data
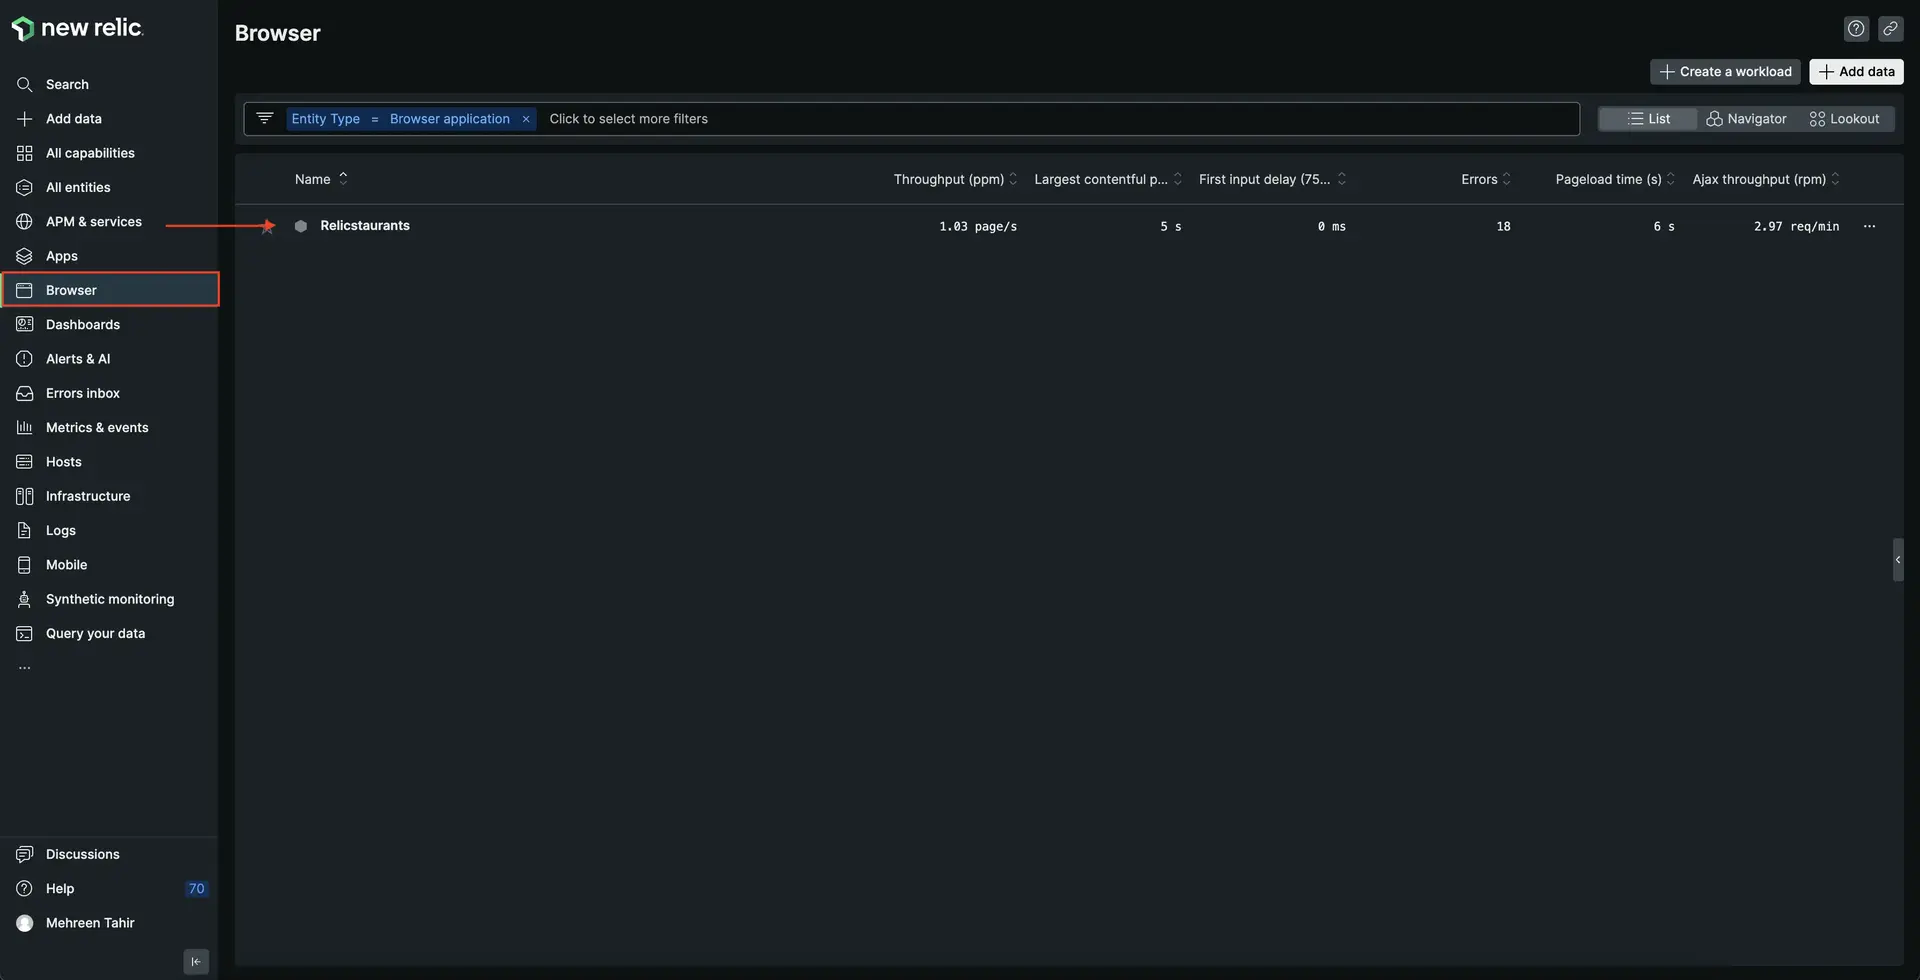
Your app is now sending browser data to New Relic. View this data in New Relic, under **Browser**.
1. Navigate to [New Relic](https://one.newrelic.com/) and sign in with your account.
2. From the left hand navigation bar, navigate to **Browser** and select **Relicstaurants**.
Here, you see **Page views with JavaScript errors**, **Core web vitals**, **User time on the site**, **Initial page load and route changes**, and other performance data from your app.
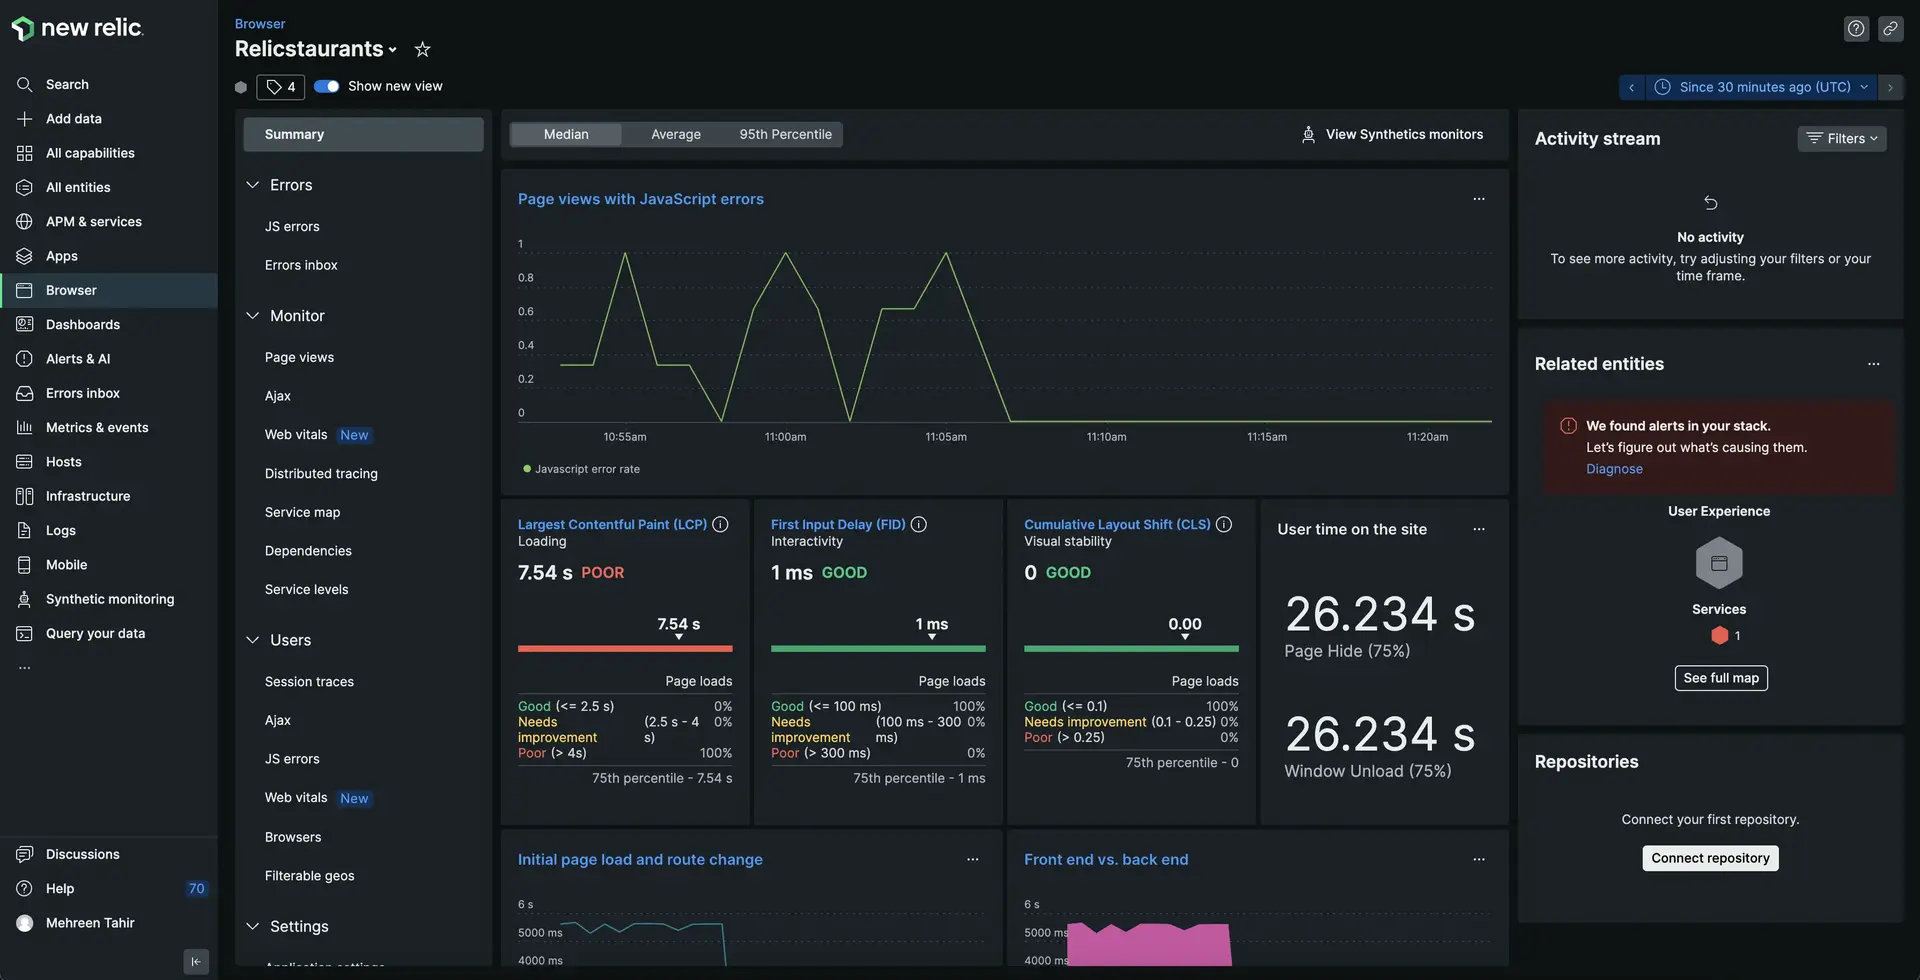
You've instrumented your application to send browser data to New Relic using our browser agent. You also see your performance data in New Relic. Next, you use this data to troubleshoot front-end errors with your site.
> #### 💡 LAB
>
> This procedure is part of a lab that teaches you how to troubleshoot your web app with New Relic browser monitoring. Now that you've instrumented your application with our browser agent, [debug errors](https://docs.newrelic.com/docs/browser/new-relic-browser/lab/debug-errors/).