• /
  • EnglishEspañol日本語한국어Português
  • Log inStart now

Introduction to AWS Lambda monitoring

As your organization transitions to a Function-as-a-Service (FaaS) architecture with AWS Lambda, understanding and optimizing function performance becomes critical for ensuring a seamless and efficient user experience. Each Lambda invocation represents a potential bottleneck or opportunity for improvement.

New Relic's instrumentation for AWS Lambda provides deep visibility into the inner workings of your functions. By adding the New Relic agent to your function, each time your function is invoked, New Relic is too. You can gain insights into key performance metrics such as duration, cold starts, exceptions, and tracebacks.

This doc explains New Relic's Lambda monitoring architecture and walks you through linking your AWS and New Relic accounts. You must link your accounts before you can instrument your functions.

How the Lambda instrumentation works

These are the essential elements of AWS Lambda instrumentation with New Relic:

  • Your function: Your function is the code you want to understand. You want to know when it's encountering errors, why it's slow, or how often it gets invoked.

  • The New Relic agent or SDK: Depending on the language your function is written in, New Relic provides different agents or SDKs. Their job is to do the actual monitoring of your code. It measures the duration of your function invocations, notes errors that occur, records details about the source events, and your functions responses. To do this, it needs to wrap around your Lambda invocation handler function.

  • The New Relic Lambda extension: When you instrument the New Relic Lambda extension in your function, it will run inside the Lambda execution environment, alongside your code. It enhances the telemetry that the agent collects and sends it to New Relic's backend in batches. It can also send your function's logs to New Relic. You don't need the Lambda extension to monitor your function with New Relic.

Choose your shipping method

There are three ways to ship your New Relic AWS Lambda telemetry. Which shipping method you choose depends on your data needs.

A screenshot depicting the different shipping methods for Lambda
  • Cost: The most cost-effective way to instrument with AWS Lambda is by using any of our layers, which include the Lambda extension. By default, our extension never sends data to AWS CloudWatch.

  • Reliability: You can ship your data through CloudWatch only. To do this, you will disable the New Relic Lambda extension. This means that your Lambda function will be lighter and won't have any additional processes running when it's invoked. In this case, logs and payloads will be sent to New Relic through CloudWatch instead of the extension.

  • Best of both worlds: Using the extension with AWS CloudWatch as a fallback helps keep costs down while providing a fail-safe in case there is a problem with the extension.

We will show you to instrument your Lambda function using each method in our instrumentation docs:

Before you begin

Before enabling serverless monitoring using our Lambda layer, you'll need:

  1. A New Relic account with either an admin role or have the Infrastructure manager add-on role.

  2. A .

  3. An AWS account with permissions for creating IAM resources, managed secrets, and Lambdas. You also need permissions for creating CloudFormation stacks and S3 buckets.

Then you'll need to complete the following:

  1. Install AWS CLI v2 configure using aws configure. You will need an AWS Access Key ID and AWS Secret Access Key.

  2. Install Python version 3.3 or higher.

  3. Install the newrelic-lambda CLI. To install it, run this command:

    bash
    $
    pip3 install newrelic-lambda-cli
  4. By default, we use the AWS Managed Policy ReadOnlyAccess. This allows the Infrastructure integration to see all the resources in your account, rather than just your Lambda functions and CloudWatch metrics. New Relic recommends this default, but we understand that some organizations prefer a strict security posture for third party integrations. If you'd like to limit New Relic's access, the IAM role can be granted with a minimum of these permissions:

    Resource: "*"
    Action:
    - "cloudwatch:GetMetricStatistics"
    - "cloudwatch:ListMetrics"
    - "cloudwatch:GetMetricData"
    - "lambda:GetAccountSettings"
    - "lambda:ListFunctions"
    - "lambda:ListAliases"
    - "lambda:ListTags"
    - "lambda:ListEventSourceMappings"
  5. Before running the CLI, you will need to grant New Relic a minimum of these permissions in AWS:

    {
    "Version": "2012-10-17",
    "Statement": [
    {
    "Sid": "CLIAccessPolicy",
    "Action": [
    "cloudformation:CreateChangeSet",
    "cloudformation:CreateStack",
    "cloudformation:DescribeStacks",
    "cloudformation:ExecuteChangeSet",
    "iam:AttachRolePolicy",
    "iam:CreateRole",
    "iam:GetRole",
    "iam:PassRole",
    "lambda:AddPermission",
    "lambda:CreateFunction",
    "lambda:GetFunction",
    "logs:DeleteSubscriptionFilter",
    "logs:DescribeSubscriptionFilters",
    "logs:PutSubscriptionFilter",
    "s3:GetObject",
    "serverlessrepo:CreateCloudFormationChangeSet",
    "secretsmanager:CreateSecret"
    ],
    "Effect": "Allow",
    "Resource": "*"
    },
    {
    "Sid": "NRLogAccessPolicy",
    "Effect": "Allow",
    "Action": [
    "serverlessrepo:CreateCloudFormationTemplate",
    "serverlessrepo:GetCloudFormationTemplate"
    ],
    "Resource": "arn:aws:serverlessrepo:us-east-1:463657938898:applications/NewRelic-log-ingestion"
    }
    ]
    }

    If you'd like to learn more about our CLI, see our CLI repo.

We recommend the following runtimes:

  • Node.js: nodejs16.x, nodejs18.x, nodejs20.x
  • Python: python3.8, python3.9, python3.10, python3.11, python3.12
  • Go: provided.al2, provided.al2023
  • Java: java8.al2, java11, java17, java21
  • Ruby: ruby3.2, ruby3.3
  • .NET: dotnet6, dotnet8

Consider costs

Enabling serverless monitoring for AWS Lambda may result in Amazon Web Services charges. Our newrelic-log-ingestion Lambda function, which reports your Lambda data to us, is considered a Third Party Service: AWS charges resulting from your use of it are your responsibility.

If you use our newrelic-lambda-extension bundled in our New Relic Lambda Layers, you can avoid sending logs and telemetry via CloudWatch and the newrelic-log-ingestion function. It's also possible to configure the newrelic-log-ingestion function as a CloudWatch fallback method for functions that require high availability of observability data.

Install Lambda monitoring

Lambda monitoring includes:

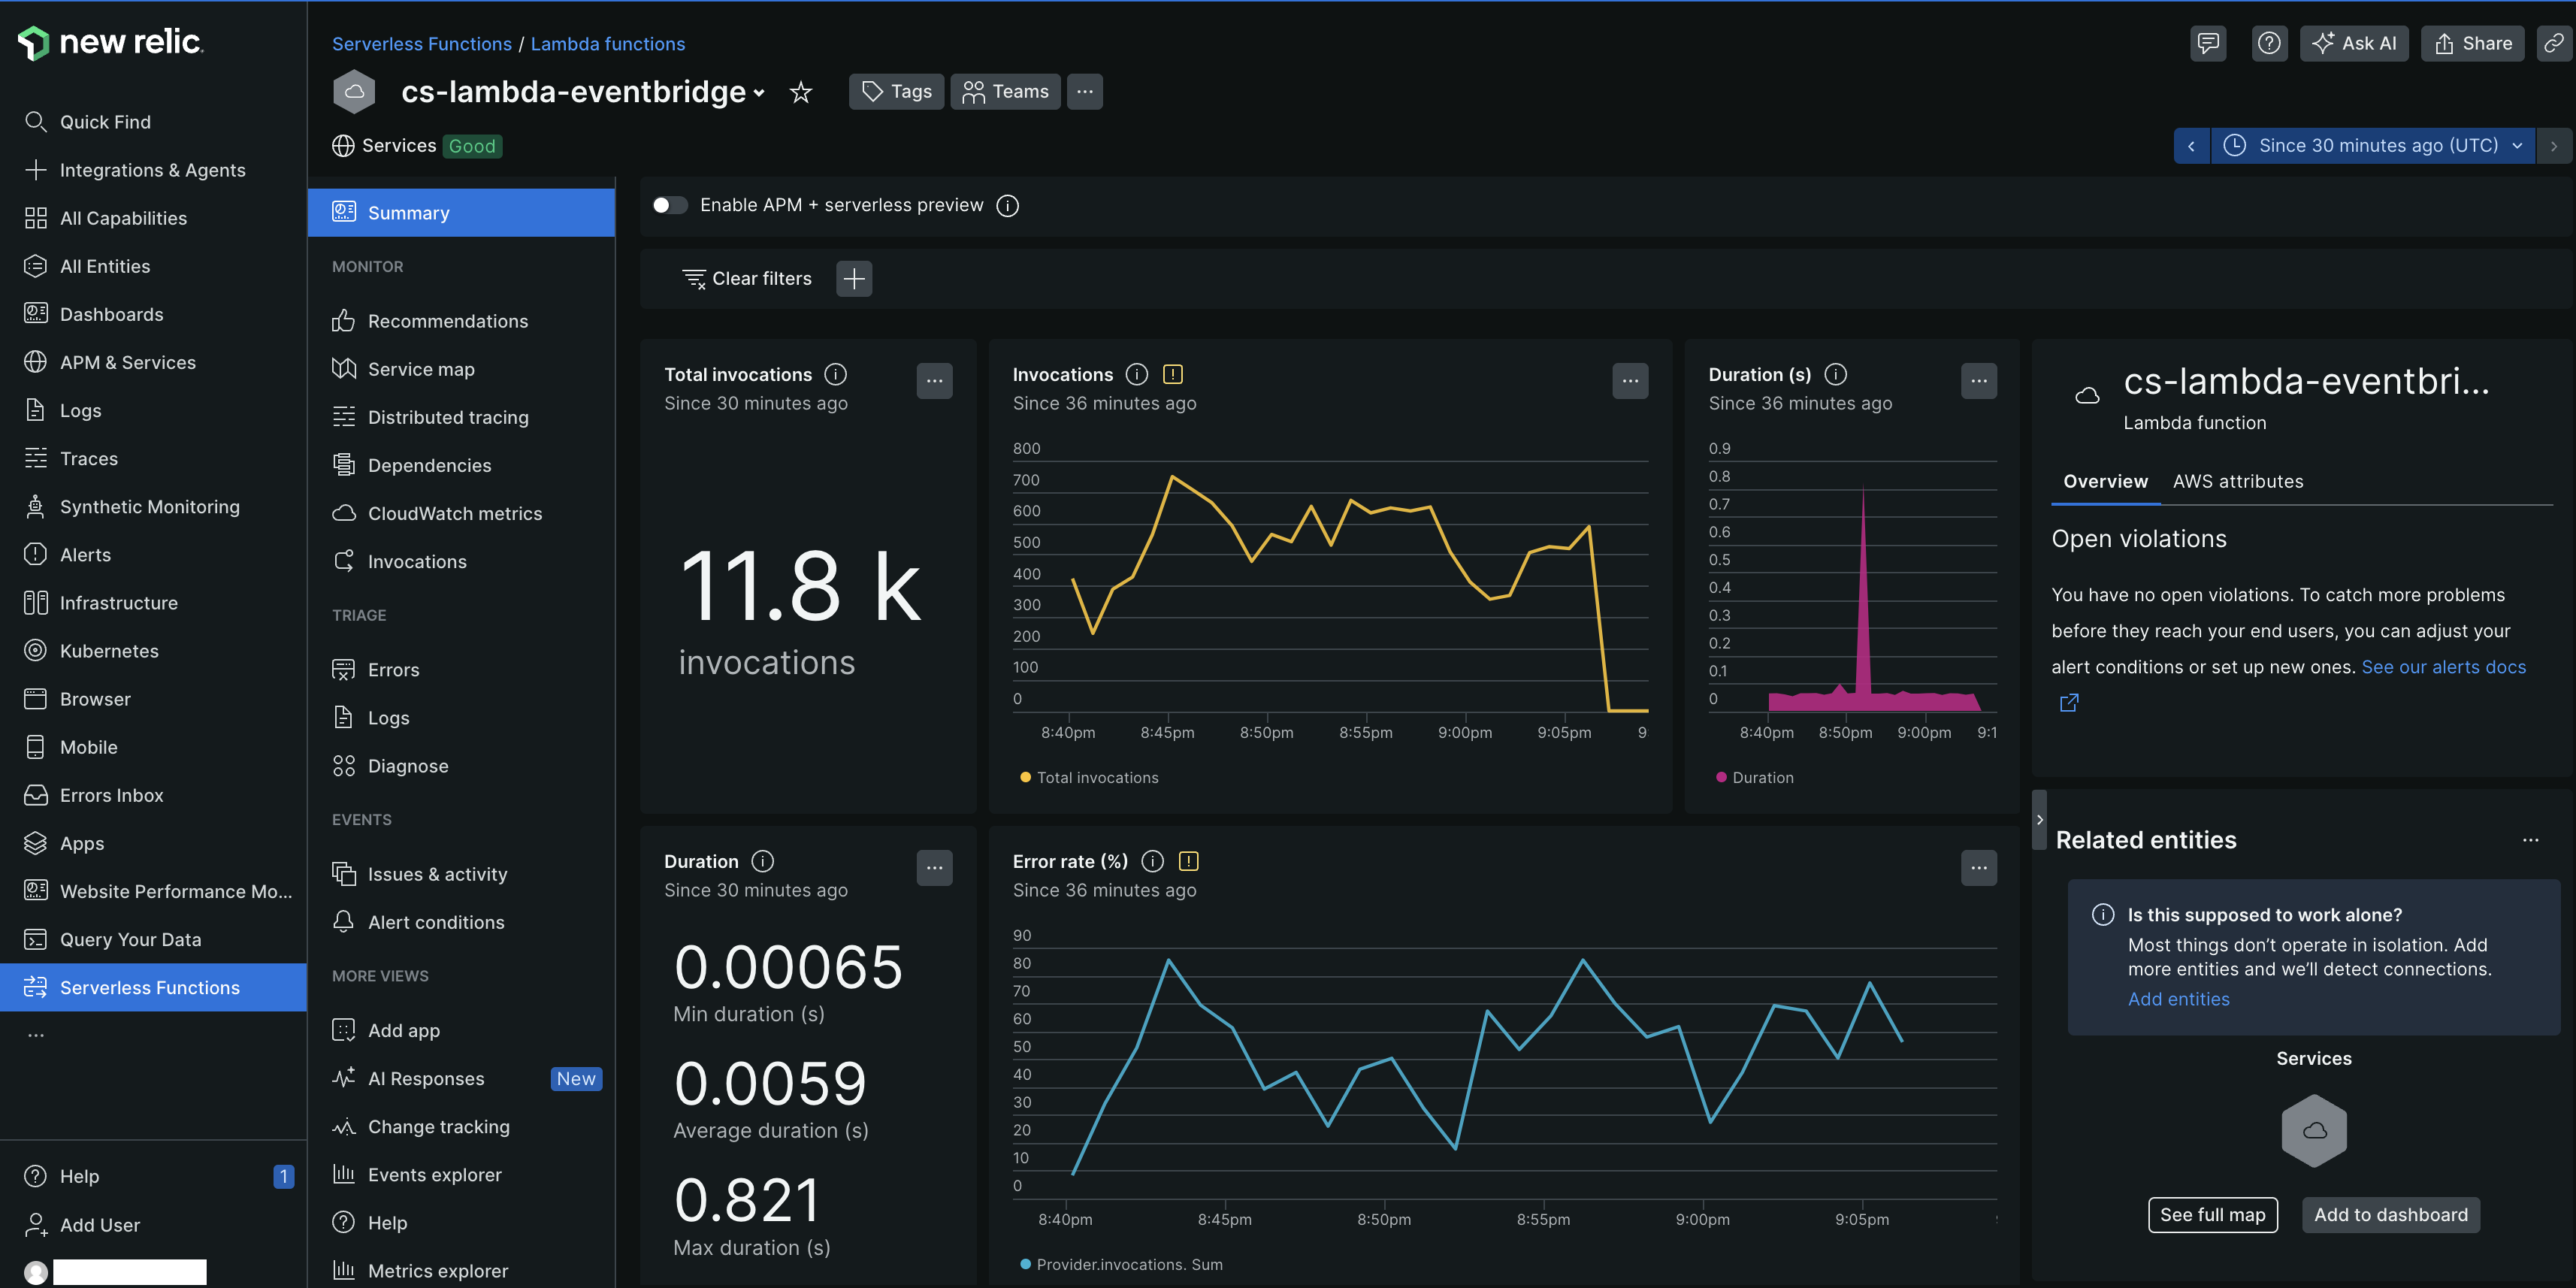
Before you can receive telemetry for your "instrumented" Lambda function in New Relic, you will need to link your AWS account to New Relic. By linking accounts, you're granting New Relic permission to create an inventory of your AWS account and automatically gather CloudWatch metrics for your Lambda functions. After you've linked accounts, resources in your AWS account will appear as entities in the entity explorer. Lambda function entities will be found in the Serverless Functions view.

For New Relic to monitor your Lambda functions, you'll need to set up an integration between New Relic and AWS. We recommend using Metric Streams to help reduce latency and avoid throttling of our polling requests.

Set up an API Polling integration with AWS

If you're not using a Metric Streams integration, you can choose to set up an API Polling integration instead. By default, an API Polling integration with the Lambda service enabled will poll every 5 minutes for CloudWatch metrics.

You can use the newrelic-lambda-cli to set up an API Polling integration, but not a Metric Streams integration.

bash
$
newrelic-lambda integrations install --nr-account-id YOUR_NR_ACCOUNT_ID \
>
--nr-api-key YOUR_NEW_RELIC_USER_KEY

One step in the integrations install command will create a NEW_RELIC_LICENSE_KEY secret in AWS Secrets Manager for improved security. This is configurable with a --disable-license-key-secret flag, along with other options and flags.

Instrument your Lambda function

There are several ways to go about adding instrumentation to your Lambda function. For "no code change" instrumentation, use a New Relic layer. You can add the layer added directly to your Lambda function or included in your dockerfile. Each layer, except the extension layer, includes an agent, handler wrapper, and extension for payload and log shipping.

The newrelic-lambda-cli is the quickest and easiest method to add a New Relic Lambda Layer. It's often used for testing rather than for CI/CD.

To add a New Relic layer via your existing CI/CD pipeline, we have a Serverless Framework plugin along with examples for SAM and Terraform.

For performance or to more tightly integrate New Relic with your function's code, you can alternatively use layerless instrumentation for all runtimes except Ruby.

Configure your Lambda function

After instrumenting your function, check in the AWS console to ensure the configuration is correct.

See the next step for more commonly used environment variables by runtime.

Environment variables

When you instrument New Relic's Lambda layer with the CLI, your environment variables with be configured automatically. You may want to change some of the default settings and configure your Lambda functions with the environment variables that match your monitoring needs. Choose your runtime to see the available environment variables and our recommendations for default settings.

Try our example functions

After you've instrumented New Relic's Lambda layer, we strongly recommend trying out our example functions. These working examples should be used as a starting point for instrumenting your own serverless functions. Using these examples can help you become familiar with the the New Relic Lambda layer, testing the account link, and they can be used as a reference for your own instrumentation. Each example demonstrates adding permissions, runtime-specific techniques for wrapping your handler, managing function log retention in CloudWatch, and more.

While there are many ways to manage and deploy Lambda functions, AWS CloudFormation is the mechanism we use for our examples.

Our examples are published, alongside the New Relic Lambda Extension, in this GitHub repository. There's one for each Lambda runtime New Relic supports:

You can also learn how to instrument distributed tracing into a non-trivial serverless application in our distributed tracing example. It illustrates manual trace propagation for SQS and SNS, two of the more popular services that might invoke Lambda functions, with Node, Python, Ruby and Java functions.

Tip

When manually testing, telemetry data can be delayed. We recommend waiting seven seconds before invoking the function again, allowing any buffered telemetry to be delivered.

Troubleshooting

If you run into issues instrumenting your Lambda function, here are some common troubleshooting tips:

What's next

Containerized Lambda functions

If you have containerized Lambda functions, click here to instrument.

Non-containerized Lambda functions

If you have non-containerized Lambda functions, click here to instrument.

Layerless Lambda functions

If you have layerless Lambda functions, click here to instrument.

Copyright © 2024 New Relic Inc.

This site is protected by reCAPTCHA and the Google Privacy Policy and Terms of Service apply.